
Page 350 - Materials Science and Engineering An Introduction
P. 350
322 • Chapter 9 / Phase Diagrams
Figure 9.13 Schematic
representations of the
equilibrium microstructures 600
L
for a lead–tin alloy of 300 y (61.9 wt%
eutectic composition C 3 Sn)
above and below the L h 500
eutectic temperature. + L
Temperature (°C) 200 18.3 183°C i + L 97.8 400 Temperature (°F)
300
100 +
200
(97.8 wt%
(18.3 wt%
Sn)
Sn)
100
y
0
0 20 40 60 80 100
(Pb) C 3 (Sn)
(61.9)
Composition (wt%Sn)
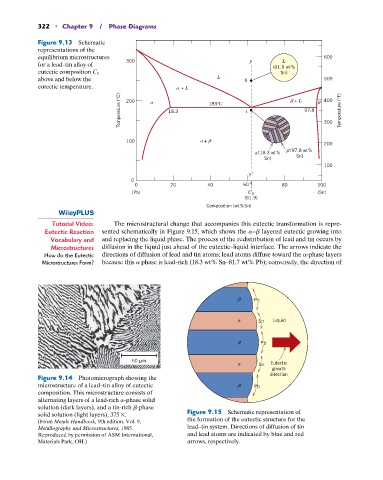
Tutorial Video: The microstructural change that accompanies this eutectic transformation is repre-
Eutectic Reaction sented schematically in Figure 9.15, which shows the a9 b layered eutectic growing into
Vocabulary and and replacing the liquid phase. The process of the redistribution of lead and tin occurs by
Microstructures diffusion in the liquid just ahead of the eutectic–liquid interface. The arrows indicate the
How do the Eutectic directions of diffusion of lead and tin atoms; lead atoms diffuse toward the a-phase layers
Microstructures Form? because this a phase is lead-rich (18.3 wt% Sn–81.7 wt% Pb); conversely, the direction of
Pb
Sn Liquid
Pb
50 m
Sn Eutectic
growth
direction
Figure 9.14 Photomicrograph showing the
microstructure of a lead–tin alloy of eutectic Pb
composition. This microstructure consists of
alternating layers of a lead-rich a-phase solid
solution (dark layers), and a tin-rich b-phase
solid solution (light layers). 375 *. Figure 9.15 Schematic representation of
(From Metals Handbook, 9th edition, Vol. 9, the formation of the eutectic structure for the
Metallography and Microstructures, 1985. lead–tin system. Directions of diffusion of tin
Reproduced by permission of ASM International, and lead atoms are indicated by blue and red
Materials Park, OH.) arrows, respectively.