
Page 381 - Materials Science and Engineering An Introduction
P. 381
Questions and Problems • 353
1100
1000
1000 L
1
800 900
1
L
Temperature (°C) 600 Temperature (°C) 800
700
400 2 2
600
1 1
2
500 2
200
0 20 40 60 80 100 400
(Sn) Composition (wt% Au) (Au)
0 4 8 12 16 20 24 28
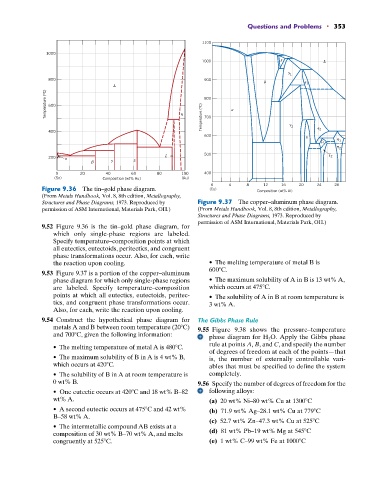
Figure 9.36 The tin–gold phase diagram. (Cu) Composition (wt% Al)
(From Metals Handbook, Vol. 8, 8th edition, Metallography,
Structures and Phase Diagrams, 1973. Reproduced by Figure 9.37 The copper–aluminum phase diagram.
permission of ASM International, Materials Park, OH.) (From Metals Handbook, Vol. 8, 8th edition, Metallography,
Structures and Phase Diagrams, 1973. Reproduced by
permission of ASM International, Materials Park, OH.)
9.52 Figure 9.36 is the tin–gold phase diagram, for
which only single-phase regions are labeled.
Specify temperature–composition points at which
all eutectics, eutectoids, peritectics, and congruent
phase transformations occur. Also, for each, write
the reaction upon cooling. • The melting temperature of metal B is
600 C.
9.53 Figure 9.37 is a portion of the copper–aluminum
phase diagram for which only single-phase regions • The maximum solubility of A in B is 13 wt% A,
are labeled. Specify temperature–composition which occurs at 475 C.
points at which all eutectics, eutectoids, peritec- • The solubility of A in B at room temperature is
tics, and congruent phase transformations occur. 3 wt% A.
Also, for each, write the reaction upon cooling.
9.54 Construct the hypothetical phase diagram for The Gibbs Phase Rule
metals A and B between room temperature (20 C) Figure 9.38 shows the pressure–temperature
and 700 C, given the following information: 9.55 phase diagram for H 2 O. Apply the Gibbs phase
• The melting temperature of metal A is 480 C. rule at points A, B, and C, and specify the number
of degrees of freedom at each of the points—that
• The maximum solubility of B in A is 4 wt% B, is, the number of externally controllable vari-
which occurs at 420 C. ables that must be specified to define the system
• The solubility of B in A at room temperature is completely.
0 wt% B. 9.56 Specify the number of degrees of freedom for the
• One eutectic occurs at 420 C and 18 wt% B–82 following alloys:
wt% A. (a) 20 wt% Ni–80 wt% Cu at 1300 C
• A second eutectic occurs at 475 C and 42 wt% (b) 71.9 wt% Ag–28.1 wt% Cu at 779 C
B–58 wt% A.
(c) 52.7 wt% Zn–47.3 wt% Cu at 525 C
• The intermetallic compound AB exists at a
composition of 30 wt% B–70 wt% A, and melts (d) 81 wt% Pb–19 wt% Mg at 545 C
congruently at 525 C. (e) 1 wt% C–99 wt% Fe at 1000 C