
Page 382 - Materials Science and Engineering An Introduction
P. 382
354 • Chapter 9 / Phase Diagrams
9.63 On the basis of the photomicrograph (i.e., the rela-
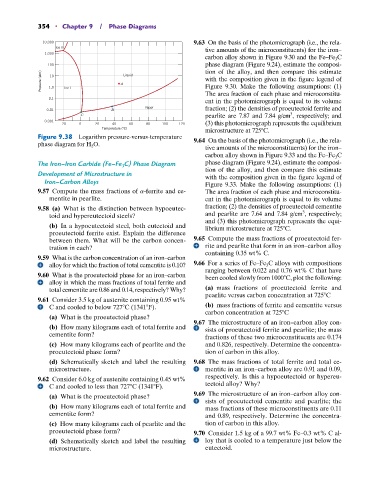
10,000
Ice III tive amounts of the microconstituents) for the iron–
1,000
carbon alloy shown in Figure 9.30 and the Fe–Fe 3 C
phase diagram (Figure 9.24), estimate the composi-
100 tion of the alloy, and then compare this estimate
Pressure (atm) 10 A Liquid with the composition given in the figure legend of
Figure 9.30. Make the following assumptions: (1)
1.0
Ice I
The area fraction of each phase and microconstitu-
ent in the photomicrograph is equal to its volume
0.1
Vapor fraction; (2) the densities of proeutectoid ferrite and
0.01 B
3
C pearlite are 7.87 and 7.84 g/cm , respectively; and
0.001 (3) this photomicrograph represents the equilibrium
–20 0 20 40 60 80 100 120
microstructure at 725 C.
Temperature (°C)
Figure 9.38 Logarithm pressure-versus-temperature 9.64 On the basis of the photomicrograph (i.e., the rela-
phase diagram for H 2 O.
tive amounts of the microconstituents) for the iron–
carbon alloy shown in Figure 9.33 and the Fe–Fe 3 C
The Iron–Iron Carbide (Fe–Fe C) Phase Diagram phase diagram (Figure 9.24), estimate the composi-
3
Development of Microstructure in tion of the alloy, and then compare this estimate
with the composition given in the figure legend of
Iron–Carbon Alloys Figure 9.33. Make the following assumptions: (1)
9.57 Compute the mass fractions of a-ferrite and ce- The area fraction of each phase and microconstitu-
mentite in pearlite. ent in the photomicrograph is equal to its volume
9.58 (a) What is the distinction between hypoeutec- fraction; (2) the densities of proeutectoid cementite
3
toid and hypereutectoid steels? and pearlite are 7.64 and 7.84 g/cm , respectively;
and (3) this photomicrograph represents the equi-
(b) In a hypoeutectoid steel, both eutectoid and librium microstructure at 725 C.
proeutectoid ferrite exist. Explain the difference
between them. What will be the carbon concen- 9.65 Compute the mass fractions of proeutectoid fer-
tration in each? rite and pearlite that form in an iron–carbon alloy
containing 0.35 wt% C.
9.59 What is the carbon concentration of an iron–carbon
alloy for which the fraction of total cementite is 0.10? 9.66 For a series of Fe–Fe 3 C alloys with compositions
ranging between 0.022 and 0.76 wt% C that have
9.60 What is the proeutectoid phase for an iron–carbon been cooled slowly from 1000 C, plot the following:
alloy in which the mass fractions of total ferrite and
total cementite are 0.86 and 0.14, respectively? Why? (a) mass fractions of proeutectoid ferrite and
pearlite versus carbon concentration at 725 C
9.61 Consider 3.5 kg of austenite containing 0.95 wt%
C and cooled to below 727 C (1341 F). (b) mass fractions of ferrite and cementite versus
carbon concentration at 725 C
(a) What is the proeutectoid phase?
9.67 The microstructure of an iron–carbon alloy con-
(b) How many kilograms each of total ferrite and sists of proeutectoid ferrite and pearlite; the mass
cementite form? fractions of these two microconstituents are 0.174
(c) How many kilograms each of pearlite and the and 0.826, respectively. Determine the concentra-
proeutectoid phase form? tion of carbon in this alloy.
(d) Schematically sketch and label the resulting 9.68 The mass fractions of total ferrite and total ce-
microstructure. mentite in an iron–carbon alloy are 0.91 and 0.09,
9.62 Consider 6.0 kg of austenite containing 0.45 wt% respectively. Is this a hypoeutectoid or hypereu-
C and cooled to less than 727 C (1341 F). tectoid alloy? Why?
(a) What is the proeutectoid phase? 9.69 The microstructure of an iron–carbon alloy con-
sists of proeutectoid cementite and pearlite; the
(b) How many kilograms each of total ferrite and mass fractions of these microconstituents are 0.11
cementite form? and 0.89, respectively. Determine the concentra-
(c) How many kilograms each of pearlite and the tion of carbon in this alloy.
proeutectoid phase form? 9.70 Consider 1.5 kg of a 99.7 wt% Fe–0.3 wt% C al-
(d) Schematically sketch and label the resulting loy that is cooled to a temperature just below the
microstructure. eutectoid.