
Page 387 - Materials Science and Engineering An Introduction
P. 387
10.3 The Kinetics of Phase Transformations • 359
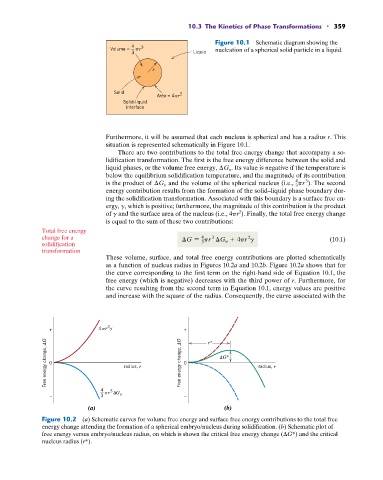
Figure 10.1 Schematic diagram showing the
4 3
Volume = r nucleation of a spherical solid particle in a liquid.
3 Liquid
r
Solid 2
Area = 4 r
Solid-liquid
interface
Furthermore, it will be assumed that each nucleus is spherical and has a radius r. This
situation is represented schematically in Figure 10.1.
There are two contributions to the total free energy change that accompany a so-
lidification transformation. The first is the free energy difference between the solid and
liquid phases, or the volume free energy, G y . Its value is negative if the temperature is
below the equilibrium solidification temperature, and the magnitude of its contribution
4
is the product of G y and the volume of the spherical nucleus (i.e., pr ). The second
3
3
energy contribution results from the formation of the solid–liquid phase boundary dur-
ing the solidification transformation. Associated with this boundary is a surface free en-
ergy, g, which is positive; furthermore, the magnitude of this contribution is the product
2
of g and the surface area of the nucleus (i.e., 4pr ). Finally, the total free energy change
is equal to the sum of these two contributions:
Total free energy
change for a G = pr G y + 4pr g (10.1)
3
4
2
solidification 3
transformation
These volume, surface, and total free energy contributions are plotted schematically
as a function of nucleus radius in Figures 10.2a and 10.2b. Figure 10.2a shows that for
the curve corresponding to the first term on the right-hand side of Equation 10.1, the
free energy (which is negative) decreases with the third power of r. Furthermore, for
the curve resulting from the second term in Equation 10.1, energy values are positive
and increase with the square of the radius. Consequently, the curve associated with the
2
+ 4 r + r*
Free energy change, G 0 radius, r Free energy change, G 0 G* radius, r
4 r G
3
– 3 v –
(a) (b)
Figure 10.2 (a) Schematic curves for volume free energy and surface free energy contributions to the total free
energy change attending the formation of a spherical embryo/nucleus during solidification. (b) Schematic plot of
free energy versus embryo/nucleus radius, on which is shown the critical free energy change ( G*) and the critical
nucleus radius (r*).