Page 389 - Materials Science and Engineering An Introduction
P. 389

10.3  The Kinetics of Phase Transformations  •  361

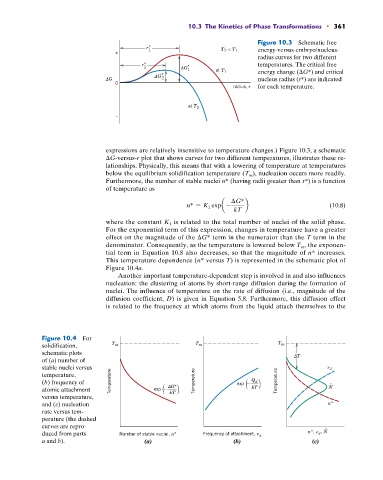
                                                                              Figure 10.3  Schematic free
                                             r*                    T  < T     energy-versus-embryo/nucleus-
                                    +         1                     2   1
                                                                              radius curves for two different
                                            r*                                temperatures. The critical free
                                            2             G * 1   at T 1      energy change ( G*) and critical
                                                  G *
                                   G              2                           nucleus radius (r*) are indicated
                                    0
                                                                       radius, r  for each temperature.

                                                          at T 2
                                    –


                                 expressions are relatively insensitive to temperature changes.) Figure 10.3, a schematic
                                  G-versus-r plot that shows curves for two different temperatures, illustrates these re-
                                 lationships. Physically, this means that with a lowering of temperature at temperatures
                                 below the equilibrium solidification temperature (T m ), nucleation occurs more readily.
                                 Furthermore, the number of stable nuclei n* (having radii greater than r*) is a function
                                 of temperature as
                                                                       G*
                                                         n* = K 1  expa -  b                        (10.8)
                                                                       kT
                                 where the constant K 1  is related to the total number of nuclei of the solid phase.
                                 For the exponential term of this expression, changes in temperature have a greater
                                 effect on the magnitude of the  G* term in the numerator than the T term in the
                                 denominator. Consequently, as the temperature is lowered below T m , the exponen-
                                 tial term in Equation 10.8 also decreases, so that the magnitude of n* increases.
                                 This temperature dependence (n* versus T) is represented in the schematic plot of
                                 Figure 10.4a.
                                    Another important temperature-dependent step is involved in and also influences
                                 nucleation: the clustering of atoms by short-range diffusion during the formation of
                                 nuclei. The influence of temperature on the rate of diffusion (i.e., magnitude of the
                                 diffusion coefficient, D) is given in Equation 5.8. Furthermore, this diffusion effect
                                 is related to the frequency at which atoms from the liquid attach themselves to the


              Figure 10.4  For
              solidification,      T m                      T m                     T m
              schematic plots                                                             T
              of (a) number of
              stable nuclei versus                                                                   d
               temperature,
              (b) frequency of    Temperature              Temperature  exp –  Q d  Temperature     .
              atomic attachment                exp –   G*                    kT                     N
                                                    kT
              versus temperature,
              and (c) nucleation                                                                    n*
              rate versus tem-
              perature (the dashed
              curves are repro-                                                                    .
              duced from parts       Number of stable nuclei, n*  Frequency of attachment,   d  n*,   , N
                                                                                                 d
              a and b).                     (a)                        (b)                     (c)
   384   385   386   387   388   389   390   391   392   393   394