
Page 384 - Materials Science and Engineering An Introduction
P. 384
C h a p t e r 10 Phase Transformations:
Development of
Microstructure and Alteration
of Mechanical Properties
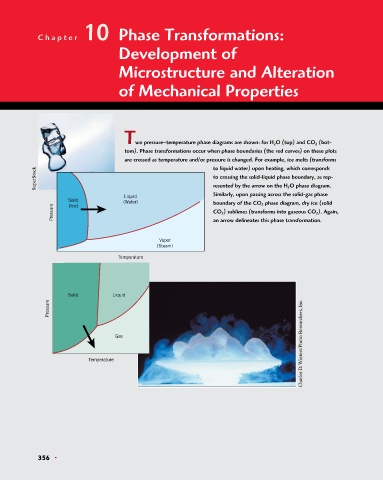
Two pressure–temperature phase diagrams are shown: for H 2 O (top) and CO 2 (bot-
tom). Phase transformations occur when phase boundaries (the red curves) on these plots
are crossed as temperature and/or pressure is changed. For example, ice melts (transforms
to liquid water) upon heating, which corresponds
SuperStock to crossing the solid-liquid phase boundary, as rep-
resented by the arrow on the H 2 O phase diagram.
Liquid Similarly, upon passing across the solid-gas phase
Solid (Water) boundary of the CO 2 phase diagram, dry ice (solid
Pressure CO 2 ) sublimes (transforms into gaseous CO 2 ). Again,
(Ice)
an arrow delineates this phase transformation.
Vapor
(Steam)
Temperature
Solid Liquid
Pressure
Charles D. Winters/Photo Researchers, Inc.
Gas
Temperature
356 •