
Page 394 - Materials Science and Engineering An Introduction
P. 394
366 • Chapter 10 / Phase Transformations
Growth
The growth step in a phase transformation begins once an embryo has exceeded the
critical size, r*, and becomes a stable nucleus. Note that nucleation will continue to oc-
cur simultaneously with growth of the new-phase particles; of course, nucleation cannot
occur in regions that have already transformed into the new phase. Furthermore, the
growth process will cease in any region where particles of the new phase meet because
here the transformation will have reached completion.
Particle growth occurs by long-range atomic diffusion, which normally involves sev-
eral steps—for example, diffusion through the parent phase, across a phase boundary,
#
and then into the nucleus. Consequently, the growth rate G is determined by the rate
of diffusion, and its temperature dependence is the same as for the diffusion coefficient
(Equation 5.8)—namely,
Dependence of
particle growth rate # Q (10.16)
on the activation G = C expa - kT b
energy for diffusion
and temperature
2
where Q (the activation energy) and C (a preexponential) are independent of temperature.
#
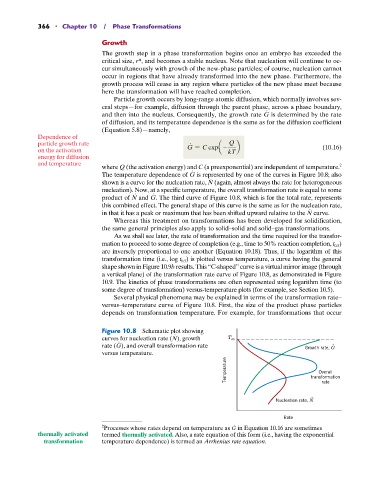
The temperature dependence of G is represented by one of the curves in Figure 10.8; also
#
shown is a curve for the nucleation rate, N (again, almost always the rate for heterogeneous
nucleation). Now, at a specific temperature, the overall transformation rate is equal to some
#
#
product of N and G. The third curve of Figure 10.8, which is for the total rate, represents
this combined effect. The general shape of this curve is the same as for the nucleation rate,
#
in that it has a peak or maximum that has been shifted upward relative to the N curve.
Whereas this treatment on transformations has been developed for solidification,
the same general principles also apply to solid–solid and solid–gas transformations.
As we shall see later, the rate of transformation and the time required for the transfor-
mation to proceed to some degree of completion (e.g., time to 50% reaction completion, t 0.5 )
are inversely proportional to one another (Equation 10.18). Thus, if the logarithm of this
transformation time (i.e., log t 0.5 ) is plotted versus temperature, a curve having the general
shape shown in Figure 10.9b results. This “C-shaped” curve is a virtual mirror image (through
a vertical plane) of the transformation rate curve of Figure 10.8, as demonstrated in Figure
10.9. The kinetics of phase transformations are often represented using logarithm time (to
some degree of transformation) versus-temperature plots (for example, see Section 10.5).
Several physical phenomena may be explained in terms of the transformation rate–
versus–temperature curve of Figure 10.8. First, the size of the product phase particles
depends on transformation temperature. For example, for transformations that occur
Figure 10.8 Schematic plot showing
#
curves for nucleation rate (N), growth T m
#
rate (G), and overall transformation rate Growth rate, G .
versus temperature.
Temperature transformation
Overall
rate
.
Nucleation rate, N
Rate
#
2 Processes whose rates depend on temperature as G in Equation 10.16 are sometimes
thermally activated termed thermally activated. Also, a rate equation of this form (i.e., having the exponential
transformation temperature dependence) is termed an Arrhenius rate equation.