
Page 395 - Materials Science and Engineering An Introduction
P. 395
10.3 The Kinetics of Phase Transformations • 367
Figure 10.9 Schematic plots of (a) trans-
T e T e formation rate versus temperature and
(b) logarithm time [to some degree (e.g., 0.5
Temperature Temperature ture. The curves in both (a) and (b) are
fraction) of transformation] versus tempera-
generated from the same set of data—that is,
for horizontal axes, the time [scaled logarith-
mically in the (b) plot] is just the reciprocal
of the rate from plot (a).
1 Time (t )
Rate 0.5
t 0.5 (logarithmic scale)
(a) (b)
at temperatures near T m , corresponding to low nucleation and high growth rates, few
nuclei form that grow rapidly. Thus, the resulting microstructure will consist of few and
relatively large particles (e.g., coarse grains). Conversely, for transformations at lower
temperatures, nucleation rates are high and growth rates low, which results in many
small particles (e.g., fine grains).
Also, from Figure 10.8, when a material is cooled very rapidly through the tempera-
ture range encompassed by the transformation rate curve to a relatively low temperature
where the rate is extremely low, it is possible to produce nonequilibrium phase structures
(e.g., see Sections 10.5 and 11.9).
Kinetic Considerations of Solid-State Transformations
The previous discussion of this section centered on the temperature dependences of nu-
cleation, growth, and transformation rates. The time dependence of rate (which is often
kinetics termed the kinetics of a transformation) is also an important consideration, especially
in the heat treatment of materials. Also, because many transformations of interest to
materials scientists and engineers involve only solid phases, we devote the following
discussion to the kinetics of solid-state transformations.
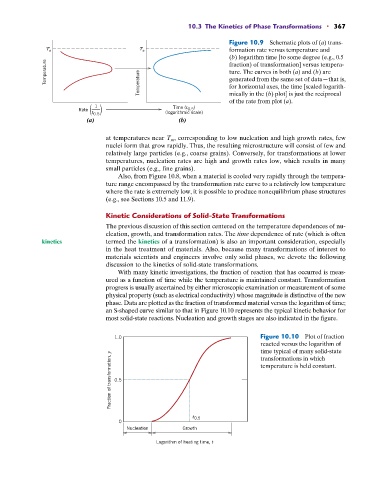
With many kinetic investigations, the fraction of reaction that has occurred is meas-
ured as a function of time while the temperature is maintained constant. Transformation
progress is usually ascertained by either microscopic examination or measurement of some
physical property (such as electrical conductivity) whose magnitude is distinctive of the new
phase. Data are plotted as the fraction of transformed material versus the logarithm of time;
an S-shaped curve similar to that in Figure 10.10 represents the typical kinetic behavior for
most solid-state reactions. Nucleation and growth stages are also indicated in the figure.
1.0 Figure 10.10 Plot of fraction
reacted versus the logarithm of
time typical of many solid-state
Fraction of transformation, y 0.5
transformations in which
temperature is held constant.
t 0.5
0
Nucleation Growth
Logarithm of heating time, t