Page 399 - Materials Science and Engineering An Introduction
P. 399

10.5 Isothermal Transformation Diagrams  •  371


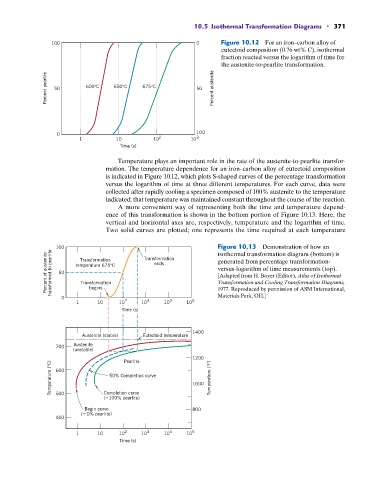
                100                                         0      Figure 10.12  For an iron–carbon alloy of
                                                                   eutectoid composition (0.76 wt% C), isothermal
                                                                   fraction reacted versus the logarithm of time for
                                                                   the austenite-to-pearlite transformation.

               Percent pearlite  50  600°C  650°C  675°C    50   Percent austenite


                                                            100
                  0
                         1          10         10 2       10 3
                                     Time (s)

                                    Temperature plays an important role in the rate of the austenite-to-pearlite transfor-
                                 mation. The temperature dependence for an iron–carbon alloy of eutectoid composition
                                 is indicated in Figure 10.12, which plots S-shaped curves of the percentage transformation
                                 versus the logarithm of time at three different temperatures. For each curve, data were
                                 collected after rapidly cooling a specimen composed of 100% austenite to the temperature
                                 indicated; that temperature was maintained constant throughout the course of the reaction.
                                    A more convenient way of representing both the time and temperature depend-
                                 ence of this transformation is shown in the bottom portion of Figure 10.13. Here, the
                                 vertical and horizontal axes are, respectively, temperature and the logarithm of time.
                                 Two solid  curves are plotted; one represents the time required at each temperature


                                                                  Figure 10.13  Demonstration of how an
               Percent of austenite transformed to pearlite 100  temperature 675°C  Transformation  isothermal transformation diagram (bottom) is
                                                                  generated from percentage transformation-
                         Transformation
                                               ends
                                                                  versus-logarithm of time measurements (top).
                   50
                                                                  [Adapted from H. Boyer (Editor), Atlas of Isothermal
                                                                  Transformation and Cooling Transformation Diagrams,
                         Transformation
                                                                  Materials Park, OH.]
                   0        begins                                1977. Reproduced by permission of ASM International,
                        1     10     10 2  10 3   10 4   10 5
                                      Time (s)

                                                           1400
                          Austenite (stable)  Eutectoid temperature
                       Austenite
                  700
                       (unstable)
                                                           1200
                                      Pearlite
                Temperature (°C)  600  50% Completion curve  1000 Temperature (°F)


                                Completion curve
                  500
                                (~100% pearlite)
                          Begin curve                      800
                         (~0% pearlite)
                  400

                        1     10     10 2  10 3   10 4   10 5
                                     Time (s)
   394   395   396   397   398   399   400   401   402   403   404