
Page 403 - Materials Science and Engineering An Introduction
P. 403
10.5 Isothermal Transformation Diagrams • 375
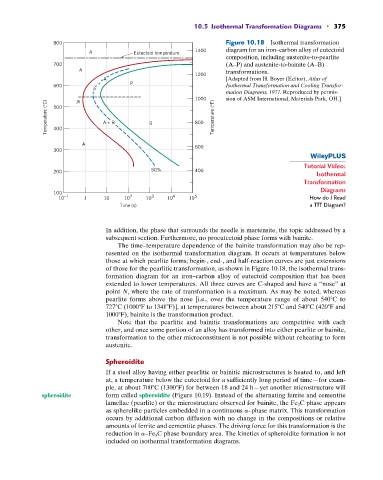
800 Figure 10.18 Isothermal transformation
A Eutectoid temperature 1400 diagram for an iron–carbon alloy of eutectoid
composition, including austenite-to-pearlite
700 (A–P) and austenite-to-bainite (A–B)
A transformations.
1200
A [Adapted from H. Boyer (Editor), Atlas of
+ P
600 Isothermal Transformation and Cooling Transfor-
P mation Diagrams, 1977. Reproduced by permis-
1000 sion of ASM International, Materials Park, OH.]
N
Temperature (°C) 400 A + B B 800 Temperature (°F)
500
A 600
300
Tutorial Video:
50% 400
200 Isothermal
Transformation
Diagrams
100
10 –1 1 10 10 2 10 3 10 4 10 5 How do I Read
Time (s) a TTT Diagram?
In addition, the phase that surrounds the needle is martensite, the topic addressed by a
subsequent section. Furthermore, no proeutectoid phase forms with bainite.
The time–temperature dependence of the bainite transformation may also be rep-
resented on the isothermal transformation diagram. It occurs at temperatures below
those at which pearlite forms; begin-, end-, and half-reaction curves are just extensions
of those for the pearlitic transformation, as shown in Figure 10.18, the isothermal trans-
formation diagram for an iron–carbon alloy of eutectoid composition that has been
extended to lower temperatures. All three curves are C-shaped and have a “nose” at
point N, where the rate of transformation is a maximum. As may be noted, whereas
pearlite forms above the nose [i.e., over the temperature range of about 540 C to
727 C (1000 F to 1341 F)], at temperatures between about 215 C and 540 C (420 F and
1000 F), bainite is the transformation product.
Note that the pearlitic and bainitic transformations are competitive with each
other, and once some portion of an alloy has transformed into either pearlite or bainite,
transformation to the other microconstituent is not possible without reheating to form
austenite.
Spheroidite
If a steel alloy having either pearlitic or bainitic microstructures is heated to, and left
at, a temperature below the eutectoid for a sufficiently long period of time—for exam-
ple, at about 700 C (1300 F) for between 18 and 24 h—yet another microstructure will
spheroidite form called spheroidite (Figure 10.19). Instead of the alternating ferrite and cementite
lamellae (pearlite) or the microstructure observed for bainite, the Fe 3 C phase appears
as spherelike particles embedded in a continuous a–phase matrix. This transformation
occurs by additional carbon diffusion with no change in the compositions or relative
amounts of ferrite and cementite phases. The driving force for this transformation is the
reduction in a–Fe 3 C phase boundary area. The kinetics of spheroidite formation is not
included on isothermal transformation diagrams.