
Page 400 - Materials Science and Engineering An Introduction
P. 400
372 • Chapter 10 / Phase Transformations
for the initiation or start of the transformation, and the other is for the transformation
conclusion. The dashed curve corresponds to 50% of transformation completion. These
curves were generated from a series of plots of the percentage transformation versus
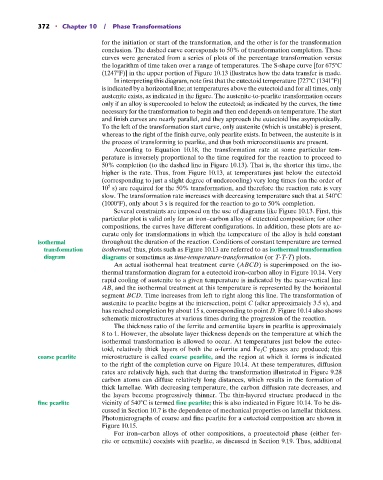
the logarithm of time taken over a range of temperatures. The S-shape curve [for 675 C
(1247 F)] in the upper portion of Figure 10.13 illustrates how the data transfer is made.
In interpreting this diagram, note first that the eutectoid temperature [727 C (1341 F)]
is indicated by a horizontal line; at temperatures above the eutectoid and for all times, only
austenite exists, as indicated in the figure. The austenite-to-pearlite transformation occurs
only if an alloy is supercooled to below the eutectoid; as indicated by the curves, the time
necessary for the transformation to begin and then end depends on temperature. The start
and finish curves are nearly parallel, and they approach the eutectoid line asymptotically.
To the left of the transformation start curve, only austenite (which is unstable) is present,
whereas to the right of the finish curve, only pearlite exists. In between, the austenite is in
the process of transforming to pearlite, and thus both microconstituents are present.
According to Equation 10.18, the transformation rate at some particular tem-
perature is inversely proportional to the time required for the reaction to proceed to
50% completion (to the dashed line in Figure 10.13). That is, the shorter this time, the
higher is the rate. Thus, from Figure 10.13, at temperatures just below the eutectoid
(corresponding to just a slight degree of undercooling) very long times (on the order of
5
10 s) are required for the 50% transformation, and therefore the reaction rate is very
slow. The transformation rate increases with decreasing temperature such that at 540 C
(1000 F), only about 3 s is required for the reaction to go to 50% completion.
Several constraints are imposed on the use of diagrams like Figure 10.13. First, this
particular plot is valid only for an iron–carbon alloy of eutectoid composition; for other
compositions, the curves have different configurations. In addition, these plots are ac-
curate only for transformations in which the temperature of the alloy is held constant
isothermal throughout the duration of the reaction. Conditions of constant temperature are termed
transformation isothermal; thus, plots such as Figure 10.13 are referred to as isothermal transformation
diagram diagrams or sometimes as time-temperature-transformation (or T-T-T) plots.
An actual isothermal heat treatment curve (ABCD) is superimposed on the iso-
thermal transformation diagram for a eutectoid iron–carbon alloy in Figure 10.14. Very
rapid cooling of austenite to a given temperature is indicated by the near-vertical line
AB, and the isothermal treatment at this temperature is represented by the horizontal
segment BCD. Time increases from left to right along this line. The transformation of
austenite to pearlite begins at the intersection, point C (after approximately 3.5 s), and
has reached completion by about 15 s, corresponding to point D. Figure 10.14 also shows
schematic microstructures at various times during the progression of the reaction.
The thickness ratio of the ferrite and cementite layers in pearlite is approximately
8 to 1. However, the absolute layer thickness depends on the temperature at which the
isothermal transformation is allowed to occur. At temperatures just below the eutec-
toid, relatively thick layers of both the a-ferrite and Fe 3 C phases are produced; this
coarse pearlite microstructure is called coarse pearlite, and the region at which it forms is indicated
to the right of the completion curve on Figure 10.14. At these temperatures, diffusion
rates are relatively high, such that during the transformation illustrated in Figure 9.28
carbon atoms can diffuse relatively long distances, which results in the formation of
thick lamellae. With decreasing temperature, the carbon diffusion rate decreases, and
the layers become progressively thinner. The thin-layered structure produced in the
fine pearlite vicinity of 540 C is termed fine pearlite; this is also indicated in Figure 10.14. To be dis-
cussed in Section 10.7 is the dependence of mechanical properties on lamellar thickness.
Photomicrographs of coarse and fine pearlite for a eutectoid composition are shown in
Figure 10.15.
For iron–carbon alloys of other compositions, a proeutectoid phase (either fer-
rite or cementite) coexists with pearlite, as discussed in Section 9.19. Thus, additional