
Page 202 - Materials Chemistry, Second Edition
P. 202
189
3.2. Metallic Structures and Properties
steel is very slowly cooled to room temperature, the resulting solid will be soft and
malleable. However, when the same steel is rapidly quenched in cold water to
temperatures less than 250 C, the normal phase transformations to pearlite/ferrite
or pearlite/cementite (depending on %C present) are suppressed. Rather, the g-Fe
phase is converted to martensite, the hardest and strongest of all possible Fe–C
microstructures. Interestingly, the formation of martensite may also occur through
fast quenching of other austenitic mixtures, such as ferrite- or cementite-rich
austenite (Eq. 16):
rapid cooling
f g Fe þ a Feg ! martensite þ a Fe
ð16Þ
rapid cooling
f g Fe þ Fe 3 Cg ! martensite þ Fe 3 C
To summarize, the relative hardness of the various phases discussed thus far
(Brinell hardness values in parentheses): martensite (300–700) > tempered mar-
tensite (300–450) > bainite (ca. 400) > fine pearlite (100–300) > coarse pearlite
(100–220) > spheroidite (90–180). The hardness and brittleness of cementite is
much greater than ferrite, whereas the latter has significantly greater ductility.
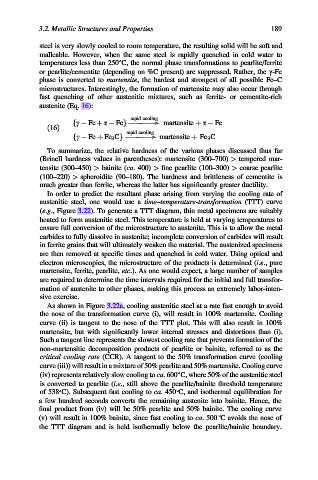
In order to predict the resultant phase arising from varying the cooling rate of
austenitic steel, one would use a time–temperature-transformation (TTT) curve
(e.g., Figure 3.22). To generate a TTT diagram, thin metal specimens are suitably
heated to form austenitic steel. This temperature is held at varying temperatures to
ensure full conversion of the microstructure to austenite. This is to allow the metal
carbides to fully dissolve in austenite; incomplete conversion of carbides will result
in ferrite grains that will ultimately weaken the material. The austenized specimens
are then removed at specific times and quenched in cold water. Using optical and
electron microscopies, the microstructure of the products is determined (i.e., pure
martensite, ferrite, pearlite, etc.). As one would expect, a large number of samples
are required to determine the time intervals required for the initial and full transfor-
mation of austenite to other phases, making this process an extremely labor-inten-
sive exercise.
As shown in Figure 3.22a, cooling austenitic steel at a rate fast enough to avoid
the nose of the transformation curve (i), will result in 100% martensite. Cooling
curve (ii) is tangent to the nose of the TTT plot. This will also result in 100%
martensite, but with significantly lower internal stresses and distortions than (i).
Such a tangent line represents the slowest cooling rate that prevents formation of the
non-martensitic decomposition products of pearlite or bainite, referred to as the
critical cooling rate (CCR). A tangent to the 50% transformation curve (cooling
curve (iii)) will result in a mixture of 50% pearlite and 50% martensite. Cooling curve
(iv) represents relatively slow cooling to ca. 600 C, where 50% of the austenitic steel
is converted to pearlite (i.e., still above the pearlite/bainite threshold temperature
of 538 C). Subsequent fast cooling to ca. 450 C, and isothermal equilibration for
a few hundred seconds converts the remaining austenite into bainite. Hence, the
final product from (iv) will be 50% pearlite and 50% bainite. The cooling curve
(v) will result in 100% bainite, since fast cooling to ca. 500 C avoids the nose of
the TTT diagram and is held isothermally below the pearlite/bainite boundary.