
Page 139 - Mathematical Models and Algorithms for Power System Optimization
P. 139
130 Chapter 5
Step 2: Preprocess data to formulate the cost coefficient, coefficient matrix, right hand
side items, range constraints, and variable constraints. Select system state (based on
methods of state enumerating or Monte Carlo simulation), including the grid structure and
the load level of all the nodes after N k.
Step 3: Carry out optimization calculation by using LP mathematical programming system.
Step 4: Output optimization calculation results.
Details of these four steps are described in the following:
5.4.1 Step One: Input Data
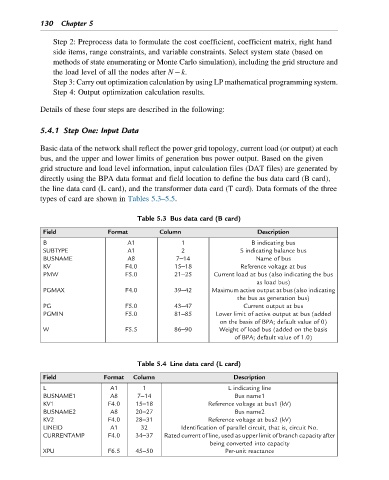
Basic data of the network shall reflect the power grid topology, current load (or output) at each
bus, and the upper and lower limits of generation bus power output. Based on the given
grid structure and load level information, input calculation files (DAT files) are generated by
directly using the BPA data format and field location to define the bus data card (B card),
the line data card (L card), and the transformer data card (T card). Data formats of the three
types of card are shown in Tables 5.3–5.5.
Table 5.3 Bus data card (B card)
Field Format Column Description
B A1 1 B indicating bus
SUBTYPE A1 2 S indicating balance bus
BUSNAME A8 7–14 Name of bus
KV F4.0 15–18 Reference voltage at bus
PMW F5.0 21–25 Current load at bus (also indicating the bus
as load bus)
PGMAX F4.0 39–42 Maximum active output at bus (also indicating
the bus as generation bus)
PG F5.0 43–47 Current output at bus
PGMIN F5.0 81–85 Lower limit of active output at bus (added
on the basis of BPA; default value of 0)
W F5.5 86–90 Weight of load bus (added on the basis
of BPA; default value of 1.0)
Table 5.4 Line data card (L card)
Field Format Column Description
L A1 1 L indicating line
BUSNAME1 A8 7–14 Bus name1
KV1 F4.0 15–18 Reference voltage at bus1 (kV)
BUSNAME2 A8 20–27 Bus name2
KV2 F4.0 28–31 Reference voltage at bus2 (kV)
LINEID A1 32 Identification of parallel circuit, that is, circuit No.
CURRENTAMP F4.0 34–37 Rated current of line, used as upper limit of branch capacity after
being converted into capacity
XPU F6.5 45–50 Per-unit reactance