
Page 157 - Mathematical Models and Algorithms for Power System Optimization
P. 157
148 Chapter 5
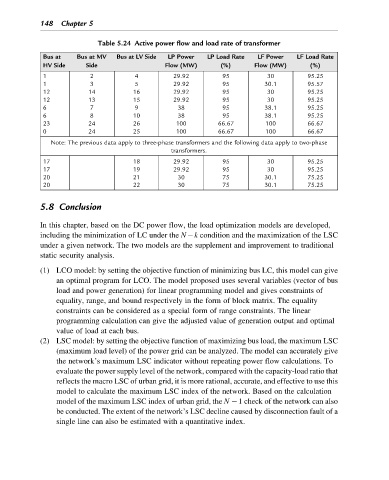
Table 5.24 Active power flow and load rate of transformer
Bus at Bus at MV Bus at LV Side LP Power LP Load Rate LF Power LF Load Rate
HV Side Side Flow (MW) (%) Flow (MW) (%)
1 2 4 29.92 95 30 95.25
1 3 5 29.92 95 30.1 95.57
12 14 16 29.92 95 30 95.25
12 13 15 29.92 95 30 95.25
6 7 9 38 95 38.1 95.25
6 8 10 38 95 38.1 95.25
23 24 26 100 66.67 100 66.67
0 24 25 100 66.67 100 66.67
Note: The previous data apply to three-phase transformers and the following data apply to two-phase
transformers.
17 18 29.92 95 30 95.25
17 19 29.92 95 30 95.25
20 21 30 75 30.1 75.25
20 22 30 75 30.1 75.25
5.8 Conclusion
In this chapter, based on the DC power flow, the load optimization models are developed,
including the minimization of LC under the N k condition and the maximization of the LSC
under a given network. The two models are the supplement and improvement to traditional
static security analysis.
(1) LCO model: by setting the objective function of minimizing bus LC, this model can give
an optimal program for LCO. The model proposed uses several variables (vector of bus
load and power generation) for linear programming model and gives constraints of
equality, range, and bound respectively in the form of block matrix. The equality
constraints can be considered as a special form of range constraints. The linear
programming calculation can give the adjusted value of generation output and optimal
value of load at each bus.
(2) LSC model: by setting the objective function of maximizing bus load, the maximum LSC
(maximum load level) of the power grid can be analyzed. The model can accurately give
the network’s maximum LSC indicator without repeating power flow calculations. To
evaluate the power supply level of the network, compared with the capacity-load ratio that
reflects the macro LSC of urban grid, it is more rational, accurate, and effective to use this
model to calculate the maximum LSC index of the network. Based on the calculation
model of the maximum LSC index of urban grid, the N 1 check of the network can also
be conducted. The extent of the network’s LSC decline caused by disconnection fault of a
single line can also be estimated with a quantitative index.