
Page 154 - Mathematical Models and Algorithms for Power System Optimization
P. 154
Load Optimization for Power Network 145
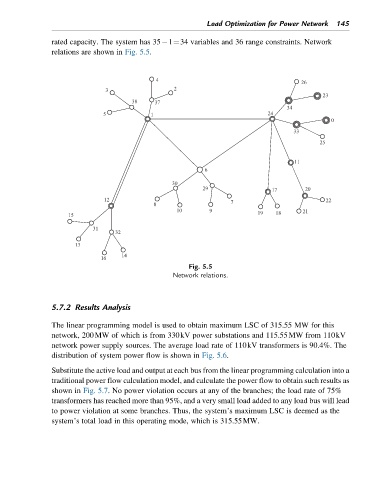
rated capacity. The system has 35 1¼34 variables and 36 range constraints. Network
relations are shown in Fig. 5.5.
Fig. 5.5
Network relations.
5.7.2 Results Analysis
The linear programming model is used to obtain maximum LSC of 315.55 MW for this
network, 200MW of which is from 330kV power substations and 115.55MW from 110kV
network power supply sources. The average load rate of 110kV transformers is 90.4%. The
distribution of system power flow is shown in Fig. 5.6.
Substitute the active load and output at each bus from the linear programming calculation into a
traditional power flow calculation model, and calculate the power flow to obtain such results as
shown in Fig. 5.7. No power violation occurs at any of the branches; the load rate of 75%
transformers has reached more than 95%, and a very small load added to any load bus will lead
to power violation at some branches. Thus, the system’s maximum LSC is deemed as the
system’s total load in this operating mode, which is 315.55MW.