
Page 151 - Mathematical Models and Algorithms for Power System Optimization
P. 151
142 Chapter 5
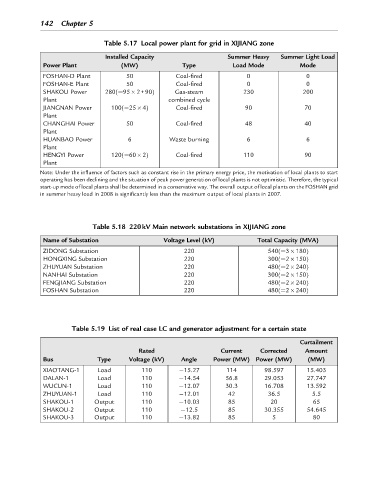
Table 5.17 Local power plant for grid in XIJIANG zone
Installed Capacity Summer Heavy Summer Light Load
Power Plant (MW) Type Load Mode Mode
FOSHAN-D Plant 50 Coal-fired 0 0
FOSHAN-E Plant 50 Coal-fired 0 0
SHAKOU Power 280(¼95 2+90) Gas-steam 230 200
Plant combined cycle
JIANGNAN Power 100(¼25 4) Coal-fired 90 70
Plant
CHANGHAI Power 50 Coal-fired 48 40
Plant
HUANBAO Power 6 Waste burning 6 6
Plant
HENGYI Power 120(¼60 2) Coal-fired 110 90
Plant
Note: Under the influence of factors such as constant rise in the primary energy price, the motivation of local plants to start
operating has been declining and the situation of peak power generation of local plants is not optimistic. Therefore, the typical
start-up mode of local plants shall be determined in a conservative way. The overall output of local plants on the FOSHAN grid
in summer heavy load in 2008 is significantly less than the maximum output of local plants in 2007.
Table 5.18 220kV Main network substations in XIJIANG zone
Name of Substation Voltage Level (kV) Total Capacity (MVA)
ZIDONG Substation 220 540(¼3 180)
HONGXING Substation 220 300(¼2 150)
ZHUYUAN Substation 220 480(¼2 240)
NANHAI Substation 220 300(¼2 150)
FENGJIANG Substation 220 480(¼2 240)
FOSHAN Substation 220 480(¼2 240)
Table 5.19 List of real case LC and generator adjustment for a certain state
Curtailment
Rated Current Corrected Amount
Bus Type Voltage (kV) Angle Power (MW) Power (MW) (MW)
XIAOTANG-1 Load 110 15.27 114 98.597 15.403
DALAN-1 Load 110 14.54 56.8 29.053 27.747
WUCUN-1 Load 110 12.07 30.3 16.708 13.592
ZHUYUAN-1 Load 110 12.01 42 36.5 5.5
SHAKOU-1 Output 110 10.03 85 20 65
SHAKOU-2 Output 110 12.5 85 30.355 54.645
SHAKOU-3 Output 110 13.82 85 5 80