Page 147 - Mathematical Models and Algorithms for Power System Optimization
P. 147

138 Chapter 5

            5.5.1.4 Results of 5-bus system for three states
            The results of LCO are identical to that of state 1 of the 5-bus system, which are solved by a
            software package for the linear programming calculation.

            (1) LCO results for state 1. One of the two circuit lines between bus 1 and bus 3 exits
                 operation. The LCO results for state 1 are shown in Table 5.13.
                                     Table 5.13 Result of LCO for State 1
                                      Result of load curtailment optimization
                                                                N-1 state power
                                              Current power flow
             Bus                   Type                         flow distribution  Curtailment (MW)
                                              distribution (MW)
                                                                   (MW)
             1                     Load             120             120               0
             2                     Load             60               60               0
             3                     Load             150             150               0
             4                    Output            100             100               0
             5                    Balance           230             230               0
                          Result of line and transformer load rate in load curtailment optimization
                                                                Carrying current
             Bus                    Bus        Safety current (A)                Load rate (%)
                                                                     (A)
             3                       1              515             350              68
             3                       2              610              70              12
             2                       1              515             280              54
                                               Main transformer
             Bus                    Bus                          Power (MW)      Load rate (%)
                                               capacity (MVA)
             5                       3              300             230              77
             4                       2              150             100              67
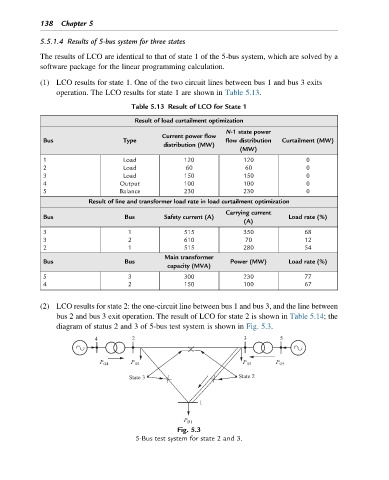
            (2) LCO results for state 2: the one-circuit line between bus 1 and bus 3, and the line between
                 bus 2 and bus 3 exit operation. The result of LCO for state 2 is shown in Table 5.14; the
                 diagram of status 2 and 3 of 5-bus test system is shown in Fig. 5.3.


                                     State 3                       State 2


                                                  Fig. 5.3
                                       5-Bus test system for state 2 and 3.
   142   143   144   145   146   147   148   149   150   151   152