
Page 148 - Mathematical Models and Algorithms for Power System Optimization
P. 148
Load Optimization for Power Network 139
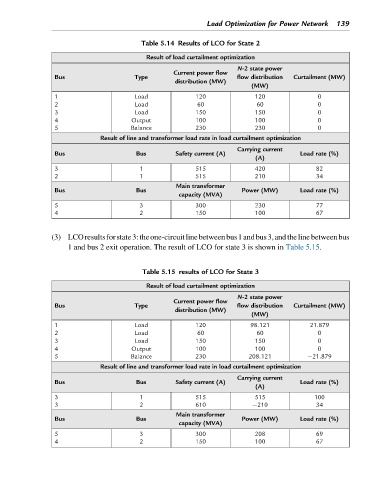
Table 5.14 Results of LCO for State 2
Result of load curtailment optimization
N-2 state power
Current power flow
Bus Type flow distribution Curtailment (MW)
distribution (MW)
(MW)
1 Load 120 120 0
2 Load 60 60 0
3 Load 150 150 0
4 Output 100 100 0
5 Balance 230 230 0
Result of line and transformer load rate in load curtailment optimization
Carrying current
Bus Bus Safety current (A) Load rate (%)
(A)
3 1 515 420 82
2 1 515 210 34
Main transformer
Bus Bus Power (MW) Load rate (%)
capacity (MVA)
5 3 300 230 77
4 2 150 100 67
(3) LCOresultsforstate3:theone-circuitlinebetweenbus1andbus3,andthelinebetweenbus
1 and bus 2 exit operation. The result of LCO for state 3 is shown in Table 5.15.
Table 5.15 results of LCO for State 3
Result of load curtailment optimization
N-2 state power
Current power flow
Bus Type flow distribution Curtailment (MW)
distribution (MW)
(MW)
1 Load 120 98.121 21.879
2 Load 60 60 0
3 Load 150 150 0
4 Output 100 100 0
5 Balance 230 208.121 21.879
Result of line and transformer load rate in load curtailment optimization
Carrying current
Bus Bus Safety current (A) Load rate (%)
(A)
3 1 515 515 100
3 2 610 210 34
Main transformer
Bus Bus Power (MW) Load rate (%)
capacity (MVA)
5 3 300 208 69
4 2 150 100 67