
Page 152 - Mathematical Models and Algorithms for Power System Optimization
P. 152
Load Optimization for Power Network 143
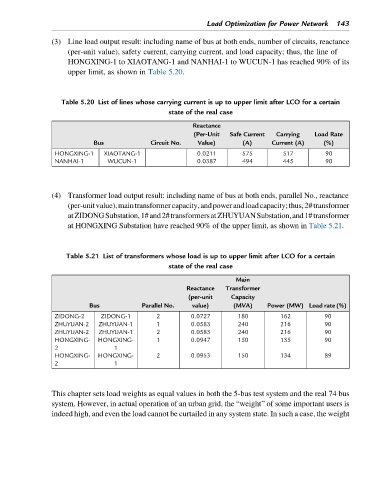
(3) Line load output result: including name of bus at both ends, number of circuits, reactance
(per-unit value), safety current, carrying current, and load capacity; thus, the line of
HONGXING-1 to XIAOTANG-1 and NANHAI-1 to WUCUN-1 has reached 90% of its
upper limit, as shown in Table 5.20.
Table 5.20 List of lines whose carrying current is up to upper limit after LCO for a certain
state of the real case
Reactance
(Per-Unit Safe Current Carrying Load Rate
Bus Circuit No. Value) (A) Current (A) (%)
HONGXING-1 XIAOTANG-1 0.0211 575 517 90
NANHAI-1 WUCUN-1 0.0387 494 445 90
(4) Transformer load output result: including name of bus at both ends, parallel No., reactance
(per-unitvalue),maintransformercapacity,andpowerandloadcapacity;thus,2#transformer
atZIDONGSubstation,1#and2#transformersatZHUYUANSubstation,and1#transformer
at HONGXING Substation have reached 90% of the upper limit, as shown in Table 5.21.
Table 5.21 List of transformers whose load is up to upper limit after LCO for a certain
state of the real case
Main
Reactance Transformer
(per-unit Capacity
Bus Parallel No. value) (MVA) Power (MW) Load rate (%)
ZIDONG-2 ZIDONG-1 2 0.0727 180 162 90
ZHUYUAN-2 ZHUYUAN-1 1 0.0583 240 216 90
ZHUYUAN-2 ZHUYUAN-1 2 0.0583 240 216 90
HONGXING- HONGXING- 1 0.0947 150 135 90
2 1
HONGXING- HONGXING- 2 0.0953 150 134 89
2 1
This chapter sets load weights as equal values in both the 5-bus test system and the real 74 bus
system. However, in actual operation of an urban grid, the “weight” of some important users is
indeed high, and even the load cannot be curtailed in any system state. In such a case, the weight