
Page 150 - Mathematical Models and Algorithms for Power System Optimization
P. 150
Load Optimization for Power Network 141
Empty
bus 6
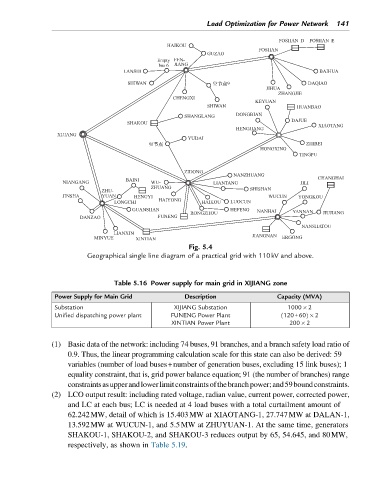
Fig. 5.4
Geographical single line diagram of a practical grid with 110kV and above.
Table 5.16 Power supply for main grid in XIJIANG zone
Power Supply for Main Grid Description Capacity (MVA)
Substation XIJIANG Substation 1000 2
Unified dispatching power plant FUNENG Power Plant (120+60) 2
XINTIAN Power Plant 200 2
(1) Basic data of the network: including 74 buses, 91 branches, and a branch safety load ratio of
0.9. Thus, the linear programming calculation scale for this state can also be derived: 59
variables (number of load buses+number of generation buses, excluding 15 link buses); 1
equality constraint, that is, grid power balance equation; 91 (the number of branches) range
constraintsasupperandlowerlimitconstraintsofthebranchpower;and59boundconstraints.
(2) LCO output result: including rated voltage, radian value, current power, corrected power,
and LC at each bus; LC is needed at 4 load buses with a total curtailment amount of
62.242MW, detail of which is 15.403MW at XIAOTANG-1, 27.747MW at DALAN-1,
13.592MW at WUCUN-1, and 5.5MW at ZHUYUAN-1. At the same time, generators
SHAKOU-1, SHAKOU-2, and SHAKOU-3 reduces output by 65, 54.645, and 80MW,
respectively, as shown in Table 5.19.