
Page 156 - Mathematical Models and Algorithms for Power System Optimization
P. 156
Load Optimization for Power Network 147
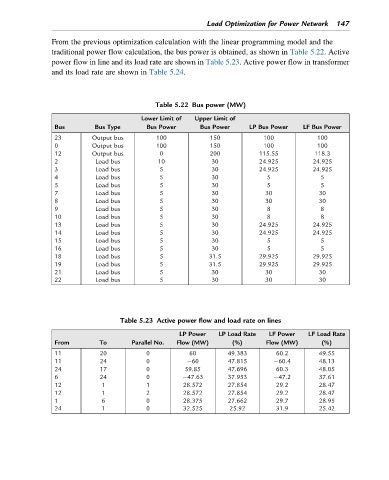
From the previous optimization calculation with the linear programming model and the
traditional power flow calculation, the bus power is obtained, as shown in Table 5.22. Active
power flow in line and its load rate are shown in Table 5.23. Active power flow in transformer
and its load rate are shown in Table 5.24.
Table 5.22 Bus power (MW)
Lower Limit of Upper Limit of
Bus Bus Type Bus Power Bus Power LP Bus Power LF Bus Power
23 Output bus 100 150 100 100
0 Output bus 100 150 100 100
12 Output bus 0 200 115.55 118.3
2 Load bus 10 30 24.925 24.925
3 Load bus 5 30 24.925 24.925
4 Load bus 5 30 5 5
5 Load bus 5 30 5 5
7 Load bus 5 30 30 30
8 Load bus 5 30 30 30
9 Load bus 5 30 8 8
10 Load bus 5 30 8 8
13 Load bus 5 30 24.925 24.925
14 Load bus 5 30 24.925 24.925
15 Load bus 5 30 5 5
16 Load bus 5 30 5 5
18 Load bus 5 31.5 29.925 29.925
19 Load bus 5 31.5 29.925 29.925
21 Load bus 5 30 30 30
22 Load bus 5 30 30 30
Table 5.23 Active power flow and load rate on lines
LP Power LP Load Rate LF Power LF Load Rate
From To Parallel No. Flow (MW) (%) Flow (MW) (%)
11 20 0 60 49.383 60.2 49.55
11 24 0 60 47.815 60.4 48.13
24 17 0 59.85 47.696 60.3 48.05
6 24 0 47.63 37.953 47.2 37.61
12 1 1 28.572 27.854 29.2 28.47
12 1 2 28.572 27.854 29.2 28.47
1 6 0 28.375 27.662 29.7 28.95
24 1 0 32.525 25.92 31.9 25.42