
Page 53 - Mathematical Models and Algorithms for Power System Optimization
P. 53
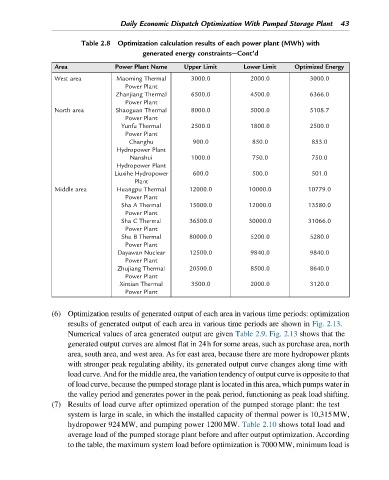
Daily Economic Dispatch Optimization With Pumped Storage Plant 43

                        Table 2.8  Optimization calculation results of each power plant (MWh) with
                                         generated energy constraints—Cont’d
                Area             Power Plant Name   Upper Limit      Lower Limit   Optimized Energy

                West area        Maoming Thermal      3000.0          2000.0           3000.0
                                    Power Plant
                                 Zhanjiang Thermal    6500.0          4500.0           6366.0
                                    Power Plant
                North area       Shaoguan Thermal     8000.0          5000.0           5108.7
                                    Power Plant
                                   Yunfu Thermal      2500.0          1800.0           2500.0
                                    Power Plant
                                     Changhu          900.0            850.0           853.0
                                 Hydropower Plant
                                     Nanshui          1000.0           750.0           750.0
                                 Hydropower Plant
                                 Liuxihe Hydropower   600.0            500.0           501.0
                                      Plant
                Middle area      Huangpu Thermal     12000.0          10000.0         10779.0
                                    Power Plant
                                   Sha A Thermal     15000.0          12000.0         13580.0
                                    Power Plant
                                   Sha C Thermal     36500.0          30000.0         31066.0
                                    Power Plant
                                   Sha B Thermal     80000.0          5200.0           5280.0
                                    Power Plant
                                  Dayawan Nuclear    12500.0          9840.0           9840.0
                                    Power Plant
                                  Zhujiang Thermal   20500.0          8500.0           8640.0
                                    Power Plant
                                  Xintian Thermal     3500.0          2000.0           3120.0
                                    Power Plant

               (6) Optimization results of generated output of each area in various time periods: optimization
                    results of generated output of each area in various time periods are shown in Fig. 2.13.
                    Numerical values of area generated output are given Table 2.9. Fig. 2.13 shows that the
                    generated output curves are almost flat in 24h for some areas, such as purchase area, north
                    area, south area, and west area. As for east area, because there are more hydropower plants
                    with stronger peak regulating ability, its generated output curve changes along time with
                    load curve. And for the middle area, the variation tendency of output curve is opposite to that
                    of load curve, because the pumped storage plant is located in this area, which pumps water in
                    the valley period and generates power in the peak period, functioning as peak load shifting.
               (7) Results of load curve after optimized operation of the pumped storage plant: the test
                    system is large in scale, in which the installed capacity of thermal power is 10,315MW,
                    hydropower 924MW, and pumping power 1200MW. Table 2.10 shows total load and
                    average load of the pumped storage plant before and after output optimization. According
                    to the table, the maximum system load before optimization is 7000MW, minimum load is