
Page 49 - Mathematical Models and Algorithms for Power System Optimization
P. 49
Daily Economic Dispatch Optimization With Pumped Storage Plant 39
2.6.5 Optimization Calculation Results
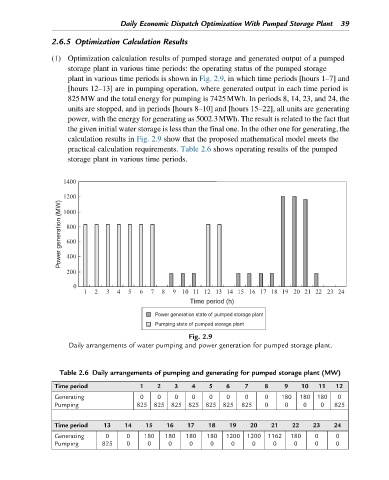
(1) Optimization calculation results of pumped storage and generated output of a pumped
storage plant in various time periods: the operating status of the pumped storage
plant in various time periods is shown in Fig. 2.9, in which time periods [hours 1–7] and
[hours 12–13] are in pumping operation, where generated output in each time period is
825MW and the total energy for pumping is 7425MWh. In periods 8, 14, 23, and 24, the
units are stopped, and in periods [hours 8–10] and [hours 15–22], all units are generating
power, with the energy for generating as 5002.3MWh. The result is related to the fact that
the given initial water storage is less than the final one. In the other one for generating, the
calculation results in Fig. 2.9 show that the proposed mathematical model meets the
practical calculation requirements. Table 2.6 shows operating results of the pumped
storage plant in various time periods.
Power generation (MW)
Time period (h)
Power generation state of pumped storage plant
Pumping state of pumped storage plant
Fig. 2.9
Daily arrangements of water pumping and power generation for pumped storage plant.
Table 2.6 Daily arrangements of pumping and generating for pumped storage plant (MW)
Time period 1 2 3 4 5 6 7 8 9 10 11 12
Generating 0 0 0 0 0 0 0 0 180 180 180 0
Pumping 825 825 825 825 825 825 825 0 0 0 0 825
Time period 13 14 15 16 17 18 19 20 21 22 23 24
Generating 0 0 180 180 180 180 1200 1200 1162 180 0 0
Pumping 825 0 0 0 0 0 0 0 0 0 0 0