Page 47 - Mathematical Models and Algorithms for Power System Optimization
P. 47

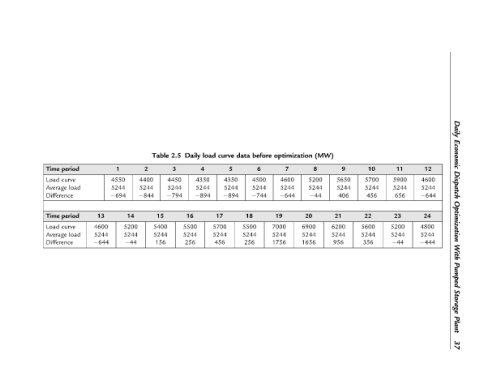
Daily Economic Dispatch Optimization With Pumped Storage Plant 37


                                                12  4600  5244   644  24  4800  5244   444


                                                11  5900  5244  656  23  5200  5244   44


                                                10  5700  5244  456  22  5600  5244  356


                                                9  5650  5244  406  21  6200  5244  956
                                             (MW)  8  5200  5244   44  20  6900  5244  1656

                                             optimization  7  4600  5244   644  19  7000  5244  1756


                                             before  6  4500  5244   744


                                             data            18  5500  5244  256

                                             curve  5  4350  5244   894  17  5700  5244  456

                                             load  4  4350  5244   894
                                             Daily           16  5500  5244  256


                                             2.5  3  4450  5244   794
                                             Table           15  5400  5244  156


                                                2  4400  5244   844
                                                             14  5200  5244   44
                                                   4550  5244
                                                1        694
                                                             13  4600  5244   644


                                                period  curve  load  period  curve  load

                                                Time  Load  Average  Difference  Time  Load  Average  Difference
   42   43   44   45   46   47   48   49   50   51   52