
Page 51 - Mathematical Models and Algorithms for Power System Optimization
P. 51
Daily Economic Dispatch Optimization With Pumped Storage Plant 41
3
Table 2.7 Reservoir water variation of pumped storage plant (10,000m )—Cont’d
Time period 13 14 15 16 17 18 19 20 21 22 23 24
Initial water 310 310 310 310 310 310 310 310 310 310 310 310
storage
Final water 350 350 350 350 350 350 350 350 350 350 350 350
storage
Optimized 738.2 738.2 722.6 706.9 691.2 675.6 571.2 466.8 365.7 350 350 350
water
storage
Maximum 850 850 850 850 850 850 850 850 850 850 850 850
water
storage
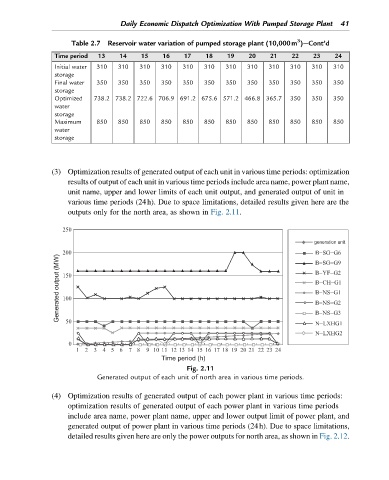
(3) Optimization results of generated output of each unit in various time periods: optimization
results of output of each unit in various time periods include area name, power plant name,
unit name, upper and lower limits of each unit output, and generated output of unit in
various time periods (24h). Due to space limitations, detailed results given here are the
outputs only for the north area, as shown in Fig. 2.11.
generation unit
Generated output (MW)
Time period (h)
Fig. 2.11
Generated output of each unit of north area in various time periods.
(4) Optimization results of generated output of each power plant in various time periods:
optimization results of generated output of each power plant in various time periods
include area name, power plant name, upper and lower output limit of power plant, and
generated output of power plant in various time periods (24h). Due to space limitations,
detailed results given here are only the power outputs for north area, as shown in Fig. 2.12.