
Page 25 - Mathematical Techniques of Fractional Order Systems
P. 25
Variable Order Fractional Derivatives and Bone Remodeling Chapter | 1 15
so-called Combination Index (CI) can be described by Eq. (1.16a),where
C is the necessary concentration of drug i, when combined with other
pi
drugs, to produce the same effect d as concentration C pi of drug i when
,
taken alone. The resulting combined effect of two drugs is given by d c 12
in Eq. (1.26).
ðC Þ ðC Þ
p 2
p 1
CI 5 1 ð1:16aÞ
ðC 50 Þ d=ð1 2 dÞ ðC 50 Þ d=ð1 2 dÞ
1
2
ðC p Þ 1 ðC p Þ 2
1
ðC 50 Þ 1 ðC 50 Þ 2
5
d c 12 ð1:16bÞ
ðC p Þ 1 ðC p Þ 2
CI 1 1
ðC 50 Þ ðC 50 Þ
1 2
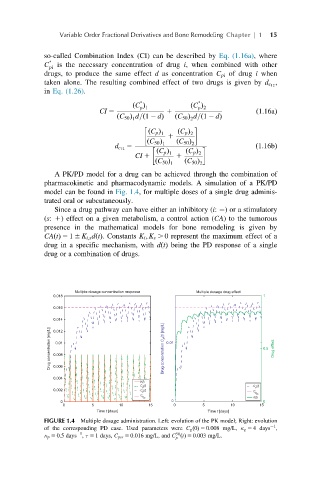
A PK/PD model for a drug can be achieved through the combination of
pharmacokinetic and pharmacodynamic models. A simulation of a PK/PD
model can be found in Fig. 1.4, for multiple doses of a single drug adminis-
trated oral or subcutaneously.
Since a drug pathway can have either an inhibitory (i: ) or a stimulatory
(s: 1) effect on a given metabolism, a control action (CA) to the tumorous
presence in the mathematical models for bone remodeling is given by
CAðtÞ 5 1 6 K i;s dðtÞ. Constants K i ; K s . 0 represent the maximum effect of a
drug in a specific mechanism, with dðtÞ being the PD response of a single
drug or a combination of drugs.
Multiple dosage concentration response Multiple dosage drug effect
0.018 1
0.016
0.014
Drug concentration [mg/L] 0.008 Drug concentration C p (t) [mg/L] 0.01 0.5 Drug effect
0.012
0.01
0.006
0.004
δ(t)
C g (t) C p (t)
0.002 C p (t)
C p ss
d(t)
C p ss
0 0 0
0 5 10 15 0 5 10 15
Time t [days] Time t [days]
FIGURE 1.4 Multiple dosage administration. Left: evolution of the PK model; Right: evolution
21
of the corresponding PD case. Used parameters were C g ð0Þ 5 0:008 mg/L, κ g 5 4 days ,
21
50
κ p 5 0:5 days , τ 5 1 days, C pss 5 0:016 mg/L, and C ðtÞ 5 0:003 mg/L.
p