
Page 114 - Matrix Analysis & Applied Linear Algebra
P. 114
108 Chapter 3 Matrix Algebra
Example 3.6.3
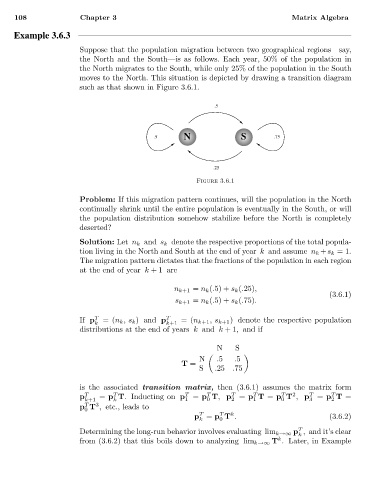
Suppose that the population migration between two geographical regions—say,
the North and the South—is as follows. Each year, 50% of the population in
the North migrates to the South, while only 25% of the population in the South
moves to the North. This situation is depicted by drawing a transition diagram
such as that shown in Figure 3.6.1.
.5
.5 N S .75
.25
Figure 3.6.1
Problem: If this migration pattern continues, will the population in the North
continually shrink until the entire population is eventually in the South, or will
the population distribution somehow stabilize before the North is completely
deserted?
Solution: Let n k and s k denote the respective proportions of the total popula-
tion living in the North and South at the end of year k and assume n k +s k =1.
The migration pattern dictates that the fractions of the population in each region
at the end of year k + 1 are
n k+1 = n k (.5) + s k (.25),
(3.6.1)
s k+1 = n k (.5) + s k (.75).
If p T =(n k ,s k ) and p T =(n k+1 ,s k+1 ) denote the respective population
k k+1
distributions at the end of years k and k +1, and if
N S
N .5 .5
T =
S .25 .75
is the associated transition matrix, then (3.6.1) assumes the matrix form
T
2
T
T
T
T
p T = p T. Inducting on p T = p T, p T = p T = p T , p T = p T =
k+1 k 1 0 2 1 0 3 2
3
T
p T , etc., leads to
0
T
k
T
p = p T . (3.6.2)
k 0
T
Determining the long-run behavior involves evaluating lim k→∞ p , and it’s clear
k
k
from (3.6.2) that this boils down to analyzing lim k→∞ T . Later, in Example