
Page 319 - Mechanical design of microresonators _ modeling and applications
P. 319
0-07-145538-8_CH06_318_08/30/05
Microcantilever and Microbridge Systems for Mass Detection
318 Chapter Six
w 1
w 2
l 1 l 2
w 1
l
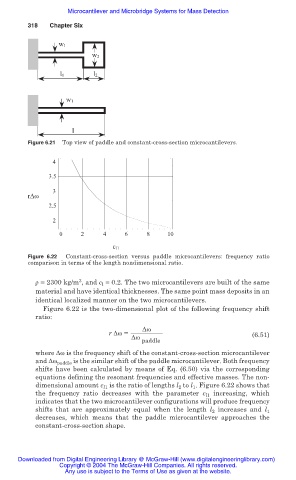
Figure 6.21 Top view of paddle and constant-cross-section microcantilevers.
4
3.5
3
r∆ω
2.5
2
0 2 4 6 8 10
c l1
Figure 6.22 Constant-cross-section versus paddle microcantilevers: frequency ratio
comparison in terms of the length nondimensional ratio.
3
ȡ = 2300 kg/m , and c l = 0.2. The two microcantilevers are built of the same
material and have identical thicknesses. The same point mass deposits in an
identical localized manner on the two microcantilevers.
Figure 6.22 is the two-dimensional plot of the following frequency shift
ratio:
ǻȦ
r ǻȦ = (6.51)
ǻȦ
paddle
where ǻȦ is the frequency shift of the constant-cross-section microcantilever
and ǻȦ paddle is the similar shift of the paddle microcantilever. Both frequency
shifts have been calculated by means of Eq. (6.50) via the corresponding
equations defining the resonant frequencies and effective masses. The non-
dimensional amount c l1 is the ratio of lengths l 2 to l 1 . Figure 6.22 shows that
the frequency ratio decreases with the parameter c l1 increasing, which
indicates that the two microcantilever configurations will produce frequency
shifts that are approximately equal when the length l 2 increases and l 1
decreases, which means that the paddle microcantilever approaches the
constant-cross-section shape.
Downloaded from Digital Engineering Library @ McGraw-Hill (www.digitalengineeringlibrary.com)
Copyright © 2004 The McGraw-Hill Companies. All rights reserved.
Any use is subject to the Terms of Use as given at the website.