
Page 323 - Mechanical design of microresonators _ modeling and applications
P. 323
0-07-145538-8_CH06_322_08/30/05
Microcantilever and Microbridge Systems for Mass Detection
322 Chapter Six
1.1
0.1
ω b,0 / ω b
1
0 0
f m
c l -6
1 × 10
1 1
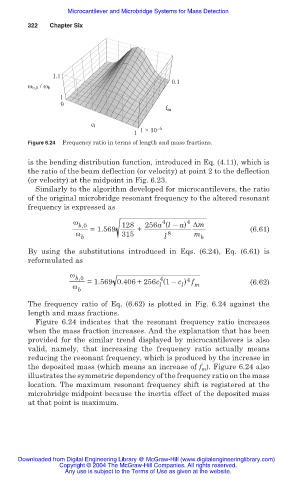
Figure 6.24 Frequency ratio in terms of length and mass fractions.
is the bending distribution function, introduced in Eq. (4.11), which is
the ratio of the beam deflection (or velocity) at point 2 to the deflection
(or velocity) at the midpoint in Fig. 6.23.
Similarly to the algorithm developed for microcantilevers, the ratio
of the original microbridge resonant frequency to the altered resonant
frequency is expressed as
Ȧ 4 4
b,0 =1.569 128 + 256a (l – a) ǻm (6.61)
Ȧ 315 8 m
b l b
By using the substitutions introduced in Eqs. (6.24), Eq. (6.61) is
reformulated as
Ȧ
b,0 =1.569 0.406 + 256c (1– c ) f
4
4
Ȧ b l l m (6.62)
The frequency ratio of Eq. (6.62) is plotted in Fig. 6.24 against the
length and mass fractions.
Figure 6.24 indicates that the resonant frequency ratio increases
when the mass fraction increases. And the explanation that has been
provided for the similar trend displayed by microcantilevers is also
valid, namely, that increasing the frequency ratio actually means
reducing the resonant frequency, which is produced by the increase in
the deposited mass (which means an increase of f ). Figure 6.24 also
m
illustrates the symmetric dependency of the frequency ratio on the mass
location. The maximum resonant frequency shift is registered at the
microbridge midpoint because the inertia effect of the deposited mass
at that point is maximum.
Downloaded from Digital Engineering Library @ McGraw-Hill (www.digitalengineeringlibrary.com)
Copyright © 2004 The McGraw-Hill Companies. All rights reserved.
Any use is subject to the Terms of Use as given at the website.