Page 327 - Mechanical design of microresonators _ modeling and applications
P. 327

0-07-145538-8_CH06_326_08/30/05


                                         Microcantilever and Microbridge Systems for Mass Detection

                              326   Chapter Six


                                     1.3
                              ω b,0 / ω b
                                      1.1
                                     0.01
                                     0.01                          c ρ
                                               c E
                                                              0.5
                                                           0.1
                                                           0.1
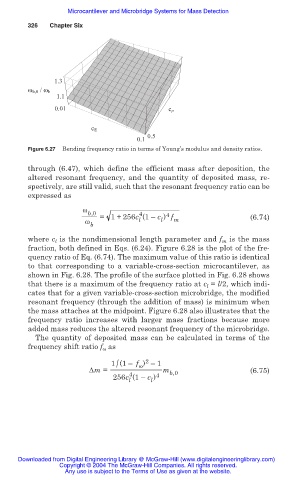
                              Figure 6.27  Bending frequency ratio in terms of Young’s modulus and density ratios.

                              through (6.47),  which define the  efficient mass after  deposition,  the
                              altered resonant frequency,  and the quantity  of deposited mass, re-
                              spectively, are still valid, such that the resonant frequency ratio can be
                              expressed as
                                            Ȧ
                                                            4
                                              b,0  = 1 + 256c (1– c ) f
                                                                   4
                                             Ȧ              l    l   m                   (6.74)
                                               b
                              where c  is the nondimensional length parameter and f  is the mass
                                                                                  m
                                     l
                              fraction, both defined in Eqs. (6.24). Figure 6.28 is the plot of the fre-
                              quency ratio of Eq. (6.74). The maximum value of this ratio is identical
                              to that corresponding  to  a variable-cross-section microcantilever, as
                              shown in Fig. 6.28. The profile of the surface plotted in Fig. 6.28 shows
                              that there is a maximum of the frequency ratio at c l  = l/2, which indi-
                              cates that for a given variable-cross-section microbridge, the modified
                              resonant frequency (through the addition of mass) is minimum when
                              the mass attaches at the midpoint. Figure 6.28 also illustrates that the
                              frequency ratio  increases with larger mass fractions because more
                              added mass reduces the altered resonant frequency of the microbridge.
                                The quantity  of deposited mass can be calculated in terms of  the
                              frequency shift ratio f  as
                                                  Ȧ
                                                             2
                                                      /
                                                    1 (1– f ) –1
                                                            Ȧ
                                              ǻm =                m b,0                  (6.75)
                                                         4
                                                     256c (1– c ) 4
                                                               l
                                                         l


                           Downloaded from Digital Engineering Library @ McGraw-Hill (www.digitalengineeringlibrary.com)
                                      Copyright © 2004 The McGraw-Hill Companies. All rights reserved.
                                        Any use is subject to the Terms of Use as given at the website.
   322   323   324   325   326   327   328   329   330   331   332