Page 330 - Mechanical design of microresonators _ modeling and applications
P. 330

0-07-145538-8_CH06_329_08/30/05


                                         Microcantilever and Microbridge Systems for Mass Detection

                                          Microcantilever and Microbridge Systems for Mass Detection  329


                                                      a
                                      w 2
                                                                  w 1
                                                   ∆m
                                                            w 1 / 2

                                      l 2          l 1
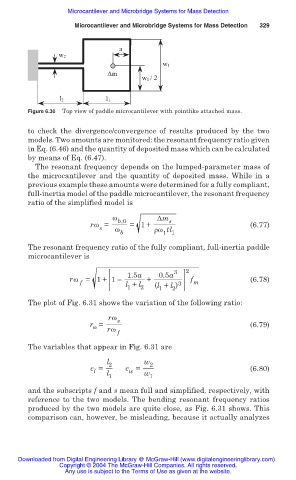
                              Figure 6.30  Top view of paddle microcantilever with pointlike attached mass.

                              to  check the divergence/convergence of results produced  by the two
                              models. Two amounts are monitored: the resonant frequency ratio given
                              in Eq. (6.46) and the quantity of deposited mass which can be calculated
                              by means of Eq. (6.47).
                                The resonant frequency depends on the lumped-parameter mass of
                              the microcantilever and the quantity of deposited  mass. While in a
                              previous example these amounts were determined for a fully compliant,
                              full-inertia model of the paddle microcantilever, the resonant frequency
                              ratio of the simplified model is

                                                    Ȧ b,0       ǻm  s
                                               rȦ =      = 1+                            (6.77)
                                                 s   Ȧ          ȡȦ tl
                                                       b          1 1
                              The resonant frequency ratio of the fully compliant, full-inertia paddle
                              microcantilever is

                                                        1.5a     0.5a 3  2
                                         rȦ = 1+ 1–           +          f               (6.78)
                                            f           l + l 2  (l + l ) 3  m
                                                        1
                                                                 1
                                                                    2
                              The plot of Fig. 6.31 shows the variation of the following ratio:
                                                   rȦ s
                                              r =                                        (6.79)
                                               Ȧ
                                                   rȦ
                                                      f
                              The variables that appear in Fig. 6.31 are
                                                   l 2       w 2
                                               c =  l 1  c =  w 1                        (6.80)
                                                         w
                                               l
                              and the subscripts f and s mean full and simplified, respectively, with
                              reference to the two models. The bending resonant frequency ratios
                              produced by the two models are quite close, as Fig. 6.31 shows. This
                              comparison can, however, be misleading, because it actually analyzes


                           Downloaded from Digital Engineering Library @ McGraw-Hill (www.digitalengineeringlibrary.com)
                                      Copyright © 2004 The McGraw-Hill Companies. All rights reserved.
                                        Any use is subject to the Terms of Use as given at the website.
   325   326   327   328   329   330   331   332   333   334   335