
Page 335 - Mechanical design of microresonators _ modeling and applications
P. 335
0-07-145538-8_CH06_334_08/30/05
Microcantilever and Microbridge Systems for Mass Detection
334 Chapter Six
1.2
0.8
r m
0.6
2.5
2.
5
c w
c l
4 4 0.4
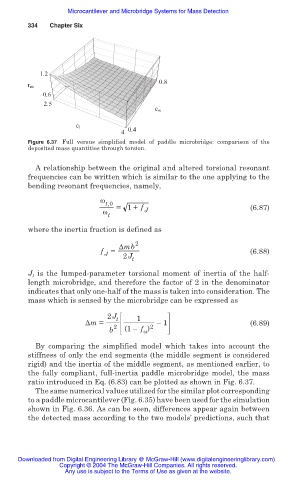
Figure 6.37 Full versus simplified model of paddle microbridge: comparison of the
deposited mass quantities through torsion.
A relationship between the original and altered torsional resonant
frequencies can be written which is similar to the one applying to the
bending resonant frequencies, namely,
Ȧ
t,0
= 1+ f (6.87)
Ȧ J
t
where the inertia fraction is defined as
ǻmb 2
f J = (6.88)
2J
t
J t is the lumped-parameter torsional moment of inertia of the half-
length microbridge, and therefore the factor of 2 in the denominator
indicates that only one-half of the mass is taken into consideration. The
mass which is sensed by the microbridge can be expressed as
2J t 1
ǻm = –1 (6.89)
b 2 (1– f ) 2
Ȧ
By comparing the simplified model which takes into account the
stiffness of only the end segments (the middle segment is considered
rigid) and the inertia of the middle segment, as mentioned earlier, to
the fully compliant, full-inertia paddle microbridge model, the mass
ratio introduced in Eq. (6.83) can be plotted as shown in Fig. 6.37.
The same numerical values utilized for the similar plot corresponding
to a paddle microcantilever (Fig. 6.35) have been used for the simulation
shown in Fig. 6.36. As can be seen, differences appear again between
the detected mass according to the two models’ predictions, such that
Downloaded from Digital Engineering Library @ McGraw-Hill (www.digitalengineeringlibrary.com)
Copyright © 2004 The McGraw-Hill Companies. All rights reserved.
Any use is subject to the Terms of Use as given at the website.