
Page 331 - Mechanical design of microresonators _ modeling and applications
P. 331
0-07-145538-8_CH06_330_08/30/05
Microcantilever and Microbridge Systems for Mass Detection
330 Chapter Six
1.02
1
r ω
1.005
0.1
0.1
c w
c l
0.1
1 1
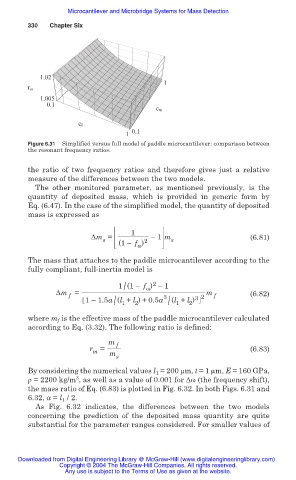
Figure 6.31 Simplified versus full model of paddle microcantilever: comparison between
the resonant frequency ratios.
the ratio of two frequency ratios and therefore gives just a relative
measure of the differences between the two models.
The other monitored parameter, as mentioned previously, is the
quantity of deposited mass, which is provided in generic form by
Eq. (6.47). In the case of the simplified model, the quantity of deposited
mass is expressed as
1
ǻm = –1 m s (6.81)
s
(1– f ) 2
Ȧ
The mass that attaches to the paddle microcantilever according to the
fully compliant, full-inertia model is
2
/
1 (1– f ) –1
Ȧ
ǻm = 3 m f (6.82)
f
(l + l )
1–1.5a (l + l ) +0.5a / 1 2 3 2
2
/ 1
where m f is the effective mass of the paddle microcantilever calculated
according to Eq. (3.32). The following ratio is defined:
m f
r = (6.83)
m
m
s
By considering the numerical values l 1 = 200 m, t = 1 m, E = 160 GPa,
3
ȡ = 2200 kg/m , as well as a value of 0.001 for ǻȦ (the frequency shift),
the mass ratio of Eq. (6.83) is plotted in Fig. 6.32. In both Figs. 6.31 and
6.32, a = l 1 / 2.
As Fig. 6.32 indicates, the differences between the two models
concerning the prediction of the deposited mass quantity are quite
substantial for the parameter ranges considered. For smaller values of
Downloaded from Digital Engineering Library @ McGraw-Hill (www.digitalengineeringlibrary.com)
Copyright © 2004 The McGraw-Hill Companies. All rights reserved.
Any use is subject to the Terms of Use as given at the website.