Page 334 - Mechanical design of microresonators _ modeling and applications
P. 334

0-07-145538-8_CH06_333_08/30/05


                                         Microcantilever and Microbridge Systems for Mass Detection

                                          Microcantilever and Microbridge Systems for Mass Detection  333


                                4
                                                                0.8
                              r m
                                2.
                                2.5
                                  5
                                                             c w
                                           c l
                                                        0.4
                                                      4 4
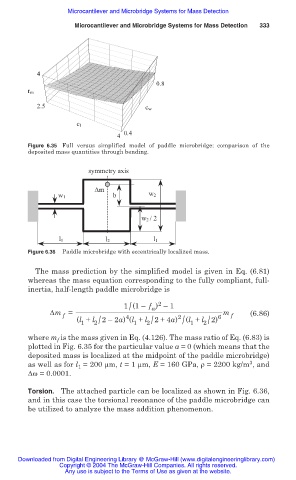
                              Figure 6.35 Full versus simplified  model  of paddle microbridge: comparison  of  the
                              deposited mass quantities through bending.

                                              symmetry axis

                                                ∆m
                                      w 1            b        w 2


                                                            w 2 / 2


                                      l 1          l 2         l 1
                              Figure 6.36  Paddle microbridge with eccentrically localized mass.

                                The mass prediction by the simplified model is given in Eq. (6.81)
                              whereas the mass equation corresponding to the fully compliant, full-
                              inertia, half-length paddle microbridge is
                                                         /
                                                                 2
                                                        1 (1– f ) –1
                                                               Ȧ
                                    ǻm =                                          m  f   (6.86)
                                       f
                                                        4
                                                              2/
                                                2/
                                           (l + l 2– 2a) (l + l 2+4a) 2  (l + l 2) 6
                                                                             2/
                                            1             1            / 1
                              where m  is the mass given in Eq. (4.126). The mass ratio of Eq. (6.83) is
                                      f
                              plotted in Fig. 6.35 for the particular value a = 0 (which means that the
                              deposited mass is localized at the midpoint of the paddle microbridge)
                                                                                         3
                              as well as for l  = 200 “m, t = 1 “m, E = 160 GPa, ȡ = 2200 kg/m , and
                                           1
                              ǻȦ = 0.0001.
                              Torsion. The attached particle can be localized as shown in Fig. 6.36,
                              and in this case the torsional resonance of the paddle microbridge can
                              be utilized to analyze the mass addition phenomenon.


                           Downloaded from Digital Engineering Library @ McGraw-Hill (www.digitalengineeringlibrary.com)
                                      Copyright © 2004 The McGraw-Hill Companies. All rights reserved.
                                        Any use is subject to the Terms of Use as given at the website.
   329   330   331   332   333   334   335   336   337