
Page 223 - Mechanical Engineers' Handbook (Volume 2)
P. 223
212 Data Acquisition and Display Systems
(a)
(b)
(c)
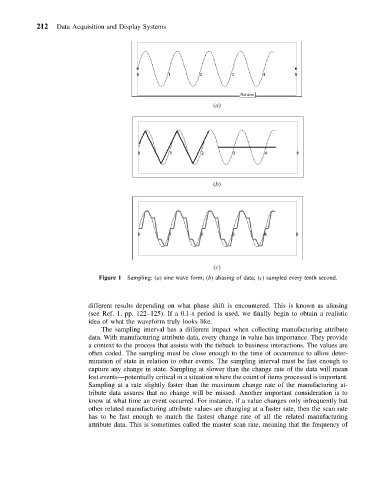
Figure 1 Sampling: (a) sine wave form; (b) aliasing of data; (c) sampled every tenth second.
different results depending on what phase shift is encountered. This is known as aliasing
(see Ref. 1, pp. 122–125). If a 0.1-s period is used, we finally begin to obtain a realistic
idea of what the waveform truly looks like.
The sampling interval has a different impact when collecting manufacturing attribute
data. With manufacturing attribute data, every change in value has importance. They provide
a context to the process that assists with the tieback to business interactions. The values are
often coded. The sampling must be close enough to the time of occurrence to allow deter-
mination of state in relation to other events. The sampling interval must be fast enough to
capture any change in state. Sampling at slower than the change rate of the data will mean
lost events—potentially critical in a situation where the count of items processed is important.
Sampling at a rate slightly faster than the maximum change rate of the manufacturing at-
tribute data assures that no change will be missed. Another important consideration is to
know at what time an event occurred. For instance, if a value changes only infrequently but
other related manufacturing attribute values are changing at a faster rate, then the scan rate
has to be fast enough to match the fastest change rate of all the related manufacturing
attribute data. This is sometimes called the master scan rate, meaning that the frequency of