
Page 227 - Mechanical Engineers' Handbook (Volume 2)
P. 227
216 Data Acquisition and Display Systems
Legend
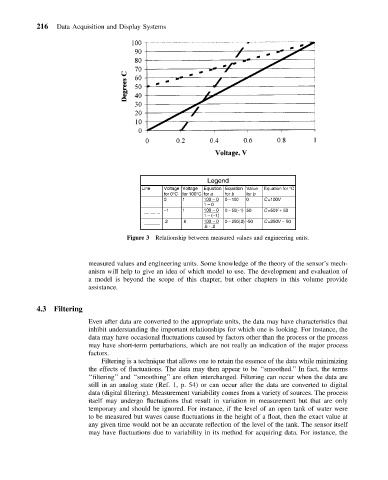
Line Voltage Voltage Equation Equation Value Equation for °C
for 0°C for 100°C for a for b for b
0 1 100 – 0 0 – 100 0 C =100V
1 – 0
–1 1 100 – 0 0 – 50(–1) 50 C =50V + 50
1 – (–1)
.2 .6 100 – 0 0 – 250(.2) -50 C =250V –50
.6 - .2
Figure 3 Relationship between measured values and engineering units.
measured values and engineering units. Some knowledge of the theory of the sensor’s mech-
anism will help to give an idea of which model to use. The development and evaluation of
a model is beyond the scope of this chapter, but other chapters in this volume provide
assistance.
4.3 Filtering
Even after data are converted to the appropriate units, the data may have characteristics that
inhibit understanding the important relationships for which one is looking. For instance, the
data may have occasional fluctuations caused by factors other than the process or the process
may have short-term perturbations, which are not really an indication of the major process
factors.
Filtering is a technique that allows one to retain the essence of the data while minimizing
the effects of fluctuations. The data may then appear to be ‘‘smoothed.’’ In fact, the terms
‘‘filtering’’ and ‘‘smoothing’’ are often interchanged. Filtering can occur when the data are
still in an analog state (Ref. 1, p. 54) or can occur after the data are converted to digital
data (digital filtering). Measurement variability comes from a variety of sources. The process
itself may undergo fluctuations that result in variation in measurement but that are only
temporary and should be ignored. For instance, if the level of an open tank of water were
to be measured but waves cause fluctuations in the height of a float, then the exact value at
any given time would not be an accurate reflection of the level of the tank. The sensor itself
may have fluctuations due to variability in its method for acquiring data. For instance, the