Page 30 - Mechanical Engineers' Handbook (Volume 2)
P. 30

3 Statistics in the Measurement Process  19


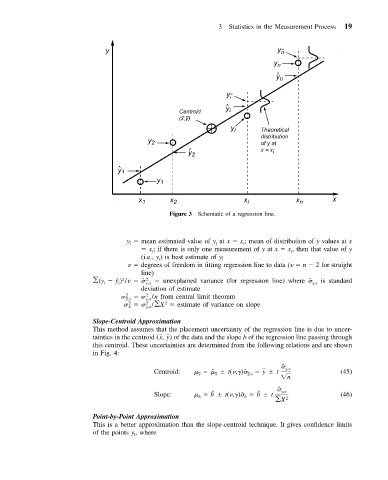
                                                Figure 3 Schematic of a regression line.


                                    y i    mean estimated value of y at x   x ; mean of distribution of y values at x
                                                                     i
                                                             i
                                          x ; if there is only one measurement of y at x   x , then that value of y
                                           i                                      i
                                        (i.e., y ) is best estimate of y
                                             i                 i
                                        degrees of freedom in fitting regression line to data (    n   2 for straight
                                        line)
                                   2
                            (y   ) /v   ˆ  2    unexplained variance (for regression line) where ˆ   is standard
                                 y
                                 ˆ
                              i   i       y,x                                           y,x
                                        deviation of estimate
                                     2      2  /n from central limit theorem
                                    y,x   y,x
                                          2
                                     2 b      / X  2    estimate of variance on slope
                                          y,x
                           Slope-Centroid Approximation
                           This method assumes that the placement uncertainty of the regression line is due to uncer-
                           tainties in the centroid (x, y ) of the data and the slope b of the regression line passing through
                           this centroid. These uncertainties are determined from the following relations and are shown
                           in Fig. 4:
                                                                               ˆ   y,x
                                            Centroid:      ˆ    t( , )ˆ  y,x    y   t           (45)
                                                        y
                                                             y
                                                                                n
                                                                              ˆ   y,x
                                                            ˆ
                                                                         ˆ
                                            Slope:         b   t( , )ˆ    b   t                 (46)
                                                                     b
                                                        b
                                                                              X  2
                           Point-by-Point Approximation
                           This is a better approximation than the slope-centroid technique. It gives confidence limits
                                     y
                           of the points , where
                                      i
   25   26   27   28   29   30   31   32   33   34   35