Page 340 - Mechanical Engineers' Handbook (Volume 2)
P. 340

5 Approaches to Linear Systems Analysis  331


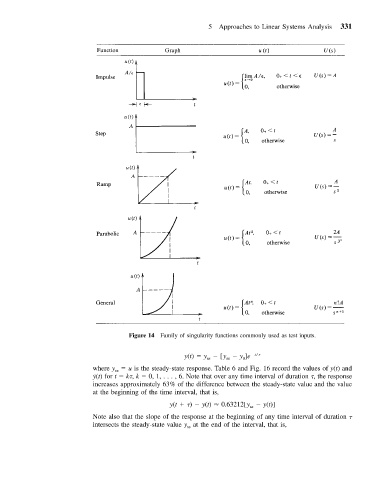
                                     Figure 14 Family of singularity functions commonly used as test inputs.

                                                    y(t)   y   [y   y ]e   t / r
                                                                ss
                                                                    0
                                                          ss
                           where y   u is the steady-state response. Table 6 and Fig. 16 record the values of y(t) and
                                 ss
                           y(t) for t   k , k   0, 1,...,6. Note that over any time interval of duration  , the response
                           ˙
                           increases approximately 63% of the difference between the steady-state value and the value
                           at the beginning of the time interval, that is,
                                                y(t    )   y(t)   0.63212[y   y(t)]
                                                                      ss
                           Note also that the slope of the response at the beginning of any time interval of duration
                           intersects the steady-state value y at the end of the interval, that is,
                                                     ss
   335   336   337   338   339   340   341   342   343   344   345