
Page 38 - Mechanical Engineers' Handbook (Volume 2)
P. 38
3 Statistics in the Measurement Process 27
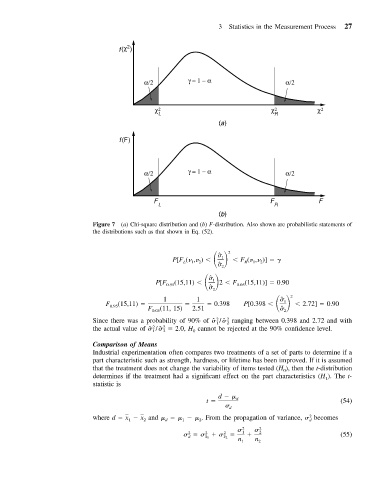
Figure 7 (a) Chi-square distribution and (b) F-distribution. Also shown are probabilistic statements of
the distributions such as that shown in Eq. (52).
P[F ( , ) 2
ˆ
1
2
L
1
1
R
2
ˆ 2 F ( , )]
(15,11)
ˆ
P[F 0.95 1 2 F 0.05 (15,11)] 0.90
ˆ 2
1 1 P[0.398 2
ˆ
F (15,11) 0.398 1 2.72] 0.90
0.95
F 0.05 (11, 15) 2.51 ˆ 2
2
Since there was a probability of 90% of ˆ /ˆ 2 2 ranging between 0.398 and 2.72 and with
1
the actual value of ˆ /ˆ 2.0 , H cannot be rejected at the 90% confidence level.
2
2
2
1
0
Comparison of Means
Industrial experimentation often compares two treatments of a set of parts to determine if a
part characteristic such as strength, hardness, or lifetime has been improved. If it is assumed
that the treatment does not change the variability of items tested (H ), then the t-distribution
0
determines if the treatment had a significant effect on the part characteristics (H ). The t-
1
statistic is
d
t d (54)
d
where d x x and . From the propagation of variance, 2 becomes
1 2 d 1 2 d
2 2
2
2 2 1 2 (55)
d
n 1 n 2
x 2
x 1