
Page 482 - Mechanical Engineers' Handbook (Volume 2)
P. 482
5 Closed-Loop Representation 473
y(t) 1 e sin t
cos t
T
d
d d (72)
where y(t) is the output.
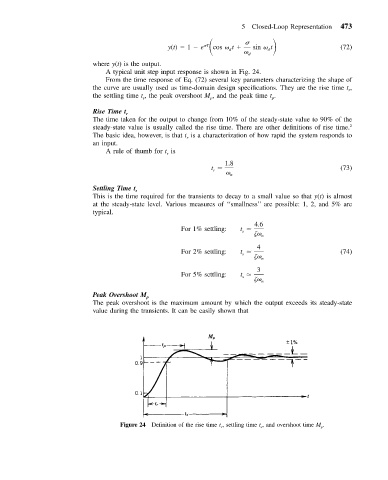
A typical unit step input response is shown in Fig. 24.
From the time response of Eq. (72) several key parameters characterizing the shape of
the curve are usually used as time-domain design specifications. They are the rise time t ,
r
the settling time t , the peak overshoot M , and the peak time t .
s
p
p
Rise Time t r
The time taken for the output to change from 10% of the steady-state value to 90% of the
steady-state value is usually called the rise time. There are other definitions of rise time. 2
The basic idea, however, is that t is a characterization of how rapid the system responds to
r
an input.
A rule of thumb for t is
r
1.8
t
(73)
r
n
Settling Time t s
This is the time required for the transients to decay to a small value so that y(t) is almost
at the steady-state level. Various measures of ‘‘smallness’’ are possible: 1, 2, and 5% are
typical.
4.6
For 1% settling: t
s
n
4
For 2% settling: t
(74)
s
n
3
For 5% settling: t
s
n
Peak Overshoot M p
The peak overshoot is the maximum amount by which the output exceeds its steady-state
value during the transients. It can be easily shown that
Figure 24 Definition of the rise time t r , settling time t s , and overshoot time M p .