
Page 93 - Mechanics Analysis Composite Materials
P. 93
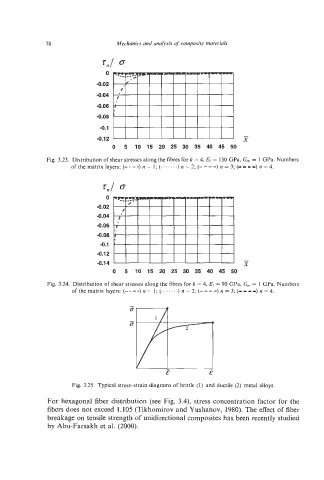
78                  Mechanics and analysis of composite materials


                               0
                            -0.02
                            -0.04
                            -0.06
                            -0.08
                             -0.1
                                                                      -
                            -0.12   I  l  l  1   I  I  I  I  I  I  I   X
                                 0   5   10  15  20  25  30  35  40  45  50

              Fig. 3.23.  Distribution of shear stresses along the fibres fork = 4, EI.= 150 GPa, G,, = I  GPa. Numbers
                     of the matrix layers: (- ---) n = I;  (. . . . ...) n = 2; (- -- -)  n = 3; (-I   I9) n = 4.


                              Tnl  0
                               0
                            -0.02
                            -0.04
                            -0.06
                            4.08
                             -0.1
                            -0.12
                                                                      -
                            -0.14                                    X
                                 o   5  io  15  20  25  30  35  40  45  50
              Fig. 3.24.  Distribution of shear stresses along the fibrcs for k = 4, EI.= 90 GPa, G,,, = I  GPa. Numbers
                     of the matrix layers: (- -- -) n = I;  (. ... .. .) n = 2; (- -- -)  n = 3; (-  II9) n  = 4.


                     Fig. 3.25.  Typical stress-strain  diagrams of  brittle (1)  and ductile (2)  metal alloys.

              For hexagonal  fiber  distribution  (see Fig. 3.4), stress concentration  factor for the
              fibers does not exceed  1.105 (Tikhomirov and Yushanov,  1980). The effect of fiber
              breakage on tensile strength of unidirectional  composites has been recently studied
              by Abu-Farsakh et al. (2000).