
Page 365 - Mechanics of Asphalt Microstructure and Micromechanics
P. 365
Digital Specimen and Digital T est-Integration of Microstructure into Simulation 357
3.5
3
Deformation(mm) 1.5
2.5
2
1
0.5
0
0 2000 4000 6000 8000
Cycles
AC=5.6% AC=6.0% AC=6.4%
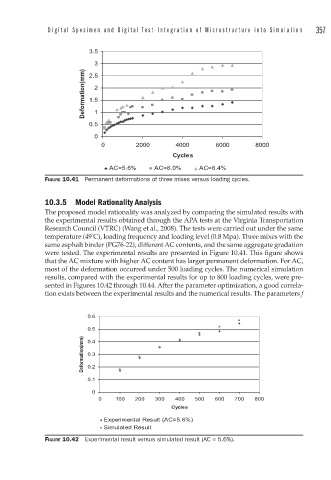
FIGURE 10.41 Permanent deformations of three mixes versus loading cycles.
10.3.5 Model Rationality Analysis
The proposed model rationality was analyzed by comparing the simulated results with
the experimental results obtained through the APA tests at the Virginia Transportation
Research Council (VTRC) (Wang et al., 2008). The tests were carried out under the same
temperature (49 C), loading frequency and loading level (0.8 Mpa). Three mixes with the
°
same asphalt binder (PG76-22), different AC contents, and the same aggregate gradation
were tested. The experimental results are presented in Figure 10.41. This figure shows
that the AC mixture with higher AC content has larger permanent deformation. For AC,
most of the deformation occurred under 500 loading cycles. The numerical simulation
results, compared with the experimental results for up to 800 loading cycles, were pre-
sented in Figures 10.42 through 10.44. After the parameter optimization, a good correla-
tion exists between the experimental results and the numerical results. The parameters f
0.6
0.5
Deformation(mm) 0.3
0.4
0.2
0.1
0
0 100 200 300 400 500 600 700 800
Cycles
Experimental Result (AC=5.6%)
Simulated Result
FIGURE 10.42 Experimental result versus simulated result (AC = 5.6%).