
Page 366 - Mechanics of Asphalt Microstructure and Micromechanics
P. 366
T
358 Ch a p t e r e n
1
0.9
0.8
Deformation(mm) 0.6
0.7
0.5
0.4
0.3
0.2
0.1
0
0 100 200 300 400 500 600 700 800
Cycles
Experimental Result (AC = 6.0%)
Simulated Result
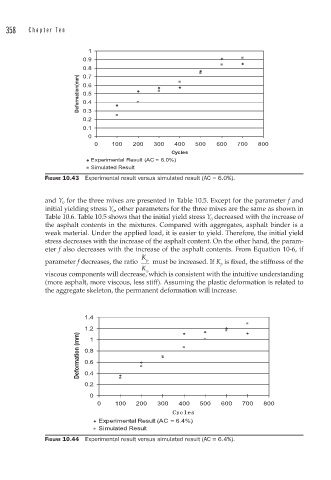
FIGURE 10.43 Experimental result versus simulated result (AC = 6.0%).
and Y 0 for the three mixes are presented in Table 10.5. Except for the parameter f and
initial yielding stress Y 0 , other parameters for the three mixes are the same as shown in
Table 10.6. Table 10.5 shows that the initial yield stress Y 0 decreased with the increase of
the asphalt contents in the mixtures. Compared with aggregates, asphalt binder is a
weak material. Under the applied load, it is easier to yield. Therefore, the initial yield
stress decreases with the increase of the asphalt content. On the other hand, the param-
eter f also decreases with the increase of the asphalt contents. From Equation 10-6, if
K
parameter f decreases, the ratio p must be increased. If K p is fixed, the stiffness of the
K
v
viscous components will decrease, which is consistent with the intuitive understanding
(more asphalt, more viscous, less stiff). Assuming the plastic deformation is related to
the aggregate skeleton, the permanent deformation will increase.
1.4
1.2
Deformation (mm) 0.8
1
0.6
0.4
0.2
0
0 100 200 300 400 500 600 700 800
Experimental Result (AC = 6.4%)
Simulated Result
FIGURE 10.44 Experimental result versus simulated result (AC = 6.4%).