
Page 363 - Mechanics of Asphalt Microstructure and Micromechanics
P. 363
Digital Specimen and Digital T est-Integration of Microstructure into Simulation 355
Step 1. Guess an initial set of parameters based on the previous studies and apply it
to the model in order to obtain the original deformed profiles for the testing sample.
Step 2. Change one parameter by 10% from its initial value and fix the other param-
eters. Then put this new set of parameters into the model and do numerical simulation
to obtain a new deformed profile.
Step 3. Compare the new deformed profile with the original profile to study the
sensitivity of the parameter on the deformation.
Repeat steps 2 and 3 for other parameters.
From the sensitivity analysis it can be seen that the total deformation is more sensi-
tive to the viscous parameters than the plastic parameters, and the most sensitive pa-
rameters are the viscous parameter f and the plastic parameter, initial yield stress Y 0 .
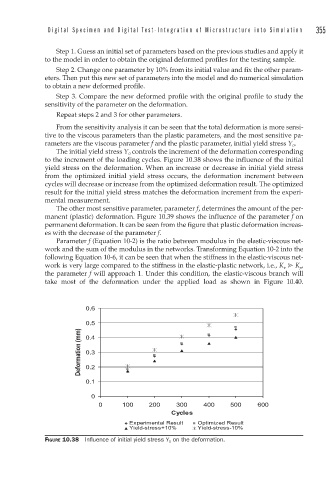
The initial yield stress Y 0 controls the increment of the deformation corresponding
to the increment of the loading cycles. Figure 10.38 shows the influence of the initial
yield stress on the deformation. When an increase or decrease in initial yield stress
from the optimized initial yield stress occurs, the deformation increment between
cycles will decrease or increase from the optimized deformation result. The optimized
result for the initial yield stress matches the deformation increment from the experi-
mental measurement.
The other most sensitive parameter, parameter f, determines the amount of the per-
manent (plastic) deformation. Figure 10.39 shows the influence of the parameter f on
permanent deformation. It can be seen from the figure that plastic deformation increas-
es with the decrease of the parameter f.
Parameter f (Equation 10-2) is the ratio between modulus in the elastic-viscous net-
work and the sum of the modulus in the networks. Transforming Equation 10-2 into the
following Equation 10-6, it can be seen that when the stiffness in the elastic-viscous net-
work is very large compared to the stiffness in the elastic-plastic network, i.e., K n K p ,
the parameter f will approach 1. Under this condition, the elastic-viscous branch will
take most of the deformation under the applied load as shown in Figure 10.40.
0.6
0.5
Deformation (mm) 0.3
0.4
0.2
0.1
0
0 100 200 300 400 500 600
Cycles
Experimental Result Optimized Result
Yield-stress+10% Yield-stress-10%
FIGURE 10.38 Infl uence of initial yield stress Y 0 on the deformation.