
Page 358 - Mechanics of Asphalt Microstructure and Micromechanics
P. 358
T
350 Ch a p t e r e n
0.07
0.06
Deformation (mm) 0.04
0.05
0.03
0.02
0.01
0
0 100 200 300 400
Cycles
Experimental Result Simulated Result
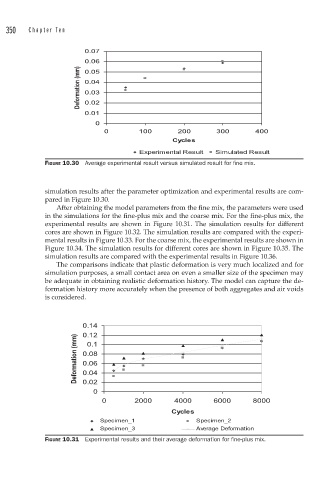
FIGURE 10.30 Average experimental result versus simulated result for fi ne mix.
simulation results after the parameter optimization and experimental results are com-
pared in Figure 10.30.
After obtaining the model parameters from the fine mix, the parameters were used
in the simulations for the fine-plus mix and the coarse mix. For the fine-plus mix, the
experimental results are shown in Figure 10.31. The simulation results for different
cores are shown in Figure 10.32. The simulation results are compared with the experi-
mental results in Figure 10.33. For the coarse mix, the experimental results are shown in
Figure 10.34. The simulation results for different cores are shown in Figure 10.35. The
simulation results are compared with the experimental results in Figure 10.36.
The comparisons indicate that plastic deformation is very much localized and for
simulation purposes, a small contact area on even a smaller size of the specimen may
be adequate in obtaining realistic deformation history. The model can capture the de-
formation history more accurately when the presence of both aggregates and air voids
is considered.
0.14
0.12
Deformation (mm) 0.08
0.1
0.06
0.04
0.02
0
0 2000 4000 6000 8000
Cycles
Specimen_1 Specimen_2
Specimen_3 Average Deformation
FIGURE 10.31 Experimental results and their average deformation for fi ne-plus mix.