
Page 357 - Mechanics of Asphalt Microstructure and Micromechanics
P. 357
Digital Specimen and Digital T est-Integration of Microstructure into Simulation 349
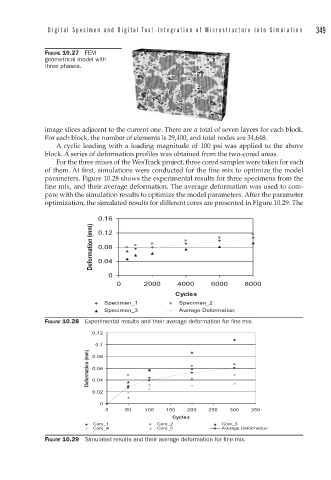
FIGURE 10.27 FEM
geometrical model with
three phases.
image slices adjacent to the current one. There are a total of seven layers for each block.
For each block, the number of elements is 29,400, and total nodes are 34,648.
A cyclic loading with a loading magnitude of 100 psi was applied to the above
block. A series of deformation profiles was obtained from the two-cored areas.
For the three mixes of the WesTrack project, three cored samples were taken for each
of them. At first, simulations were conducted for the fine mix to optimize the model
parameters. Figure 10.28 shows the experimental results for three specimens from the
fine mix, and their average deformation. The average deformation was used to com-
pare with the simulation results to optimize the model parameters. After the parameter
optimization, the simulated results for different cores are presented in Figure 10.29. The
0.16
Deformation (mm) 0.12
0.08
0.04
0
0 2000 4000 6000 8000
Cycles
Specimen_1 Specimen_2
Specimen_3 Average Deformation
FIGURE 10.28 Experimental results and their average deformation for fi ne mix.
0.12
0.1
Deformation (mm) 0.06
0.08
0.04
0.02
0
0 50 100 150 200 250 300 350
Cycles
Core_1 Core_2 Core_3
Core_4 Core_5 Average Deformation
FIGURE 10.29 Simulated results and their average deformation for fi ne mix.