
Page 356 - Mechanics of Asphalt Microstructure and Micromechanics
P. 356
T
348 Ch a p t e r e n
3.00E-02
2.50E-02
Deformation (mm) 2.00E-02
1.50E-02
1.00E-02
5.00E-03
0.00E+00
20 30 40 50 60 70 80
Vertical Element Numbers
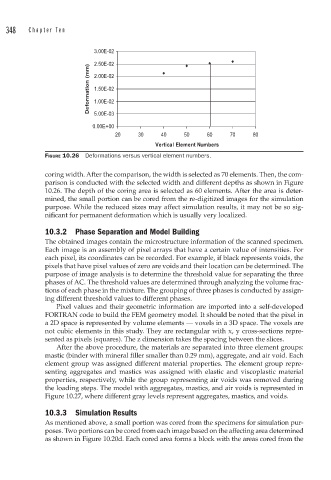
FIGURE 10.26 Deformations versus vertical element numbers.
coring width. After the comparison, the width is selected as 70 elements. Then, the com-
parison is conducted with the selected width and different depths as shown in Figure
10.26. The depth of the coring area is selected as 60 elements. After the area is deter-
mined, the small portion can be cored from the re-digitized images for the simulation
purpose. While the reduced sizes may affect simulation results, it may not be so sig-
nificant for permanent deformation which is usually very localized.
10.3.2 Phase Separation and Model Building
The obtained images contain the microstructure information of the scanned specimen.
Each image is an assembly of pixel arrays that have a certain value of intensities. For
each pixel, its coordinates can be recorded. For example, if black represents voids, the
pixels that have pixel values of zero are voids and their location can be determined. The
purpose of image analysis is to determine the threshold value for separating the three
phases of AC. The threshold values are determined through analyzing the volume frac-
tions of each phase in the mixture. The grouping of three phases is conducted by assign-
ing different threshold values to different phases.
Pixel values and their geometric information are imported into a self-developed
FORTRAN code to build the FEM geometry model. It should be noted that the pixel in
a 2D space is represented by volume elements — voxels in a 3D space. The voxels are
not cubic elements in this study. They are rectangular with x, y cross-sections repre-
sented as pixels (squares). The z dimension takes the spacing between the slices.
After the above procedure, the materials are separated into three element groups:
mastic (binder with mineral filler smaller than 0.29 mm), aggregate, and air void. Each
element group was assigned different material properties. The element group repre-
senting aggregates and mastics was assigned with elastic and viscoplastic material
properties, respectively, while the group representing air voids was removed during
the loading steps. The model with aggregates, mastics, and air voids is represented in
Figure 10.27, where different gray levels represent aggregates, mastics, and voids.
10.3.3 Simulation Results
As mentioned above, a small portion was cored from the specimens for simulation pur-
poses. Two portions can be cored from each image based on the affecting area determined
as shown in Figure 10.20d. Each cored area forms a block with the areas cored from the