
Page 351 - Mechanics of Asphalt Microstructure and Micromechanics
P. 351
Digital Specimen and Digital T est-Integration of Microstructure into Simulation 343
2
binder test
1.8
binder simu
1.6 agg test 5%
agg simu 5%
1.4 agg test 25%
Force (N) 1.2 1 agg simu 25%
agg test 50%
0.8 agg simu 50%
0.6
0.4
0.2
0
0 0.01 0.02 0.03 0.04
Displacement (mm)
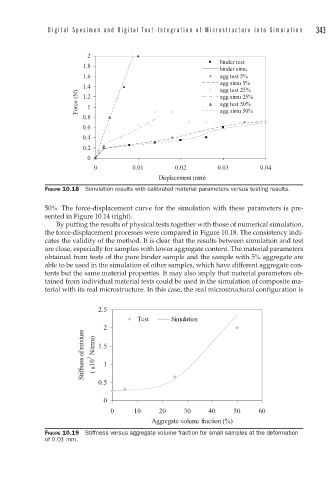
FIGURE 10.18 Simulation results with calibrated material parameters versus testing results.
50%. The force-displacement curve for the simulation with these parameters is pre-
sented in Figure 10.14 (right).
By putting the results of physical tests together with those of numerical simulation,
the force-displacement processes were compared in Figure 10.18. The consistency indi-
cates the validity of the method. It is clear that the results between simulation and test
are close, especially for samples with lower aggregate content. The material parameters
obtained from tests of the pure binder sample and the sample with 5% aggregate are
able to be used in the simulation of other samples, which have different aggregate con-
tents but the same material properties. It may also imply that material parameters ob-
tained from individual material tests could be used in the simulation of composite ma-
terial with its real microstructure. In this case, the real microstructural configuration is
2.5
Test Simulation
2
Stiffness of mixture x10 2 N/mm) 1.5
1
(
0.5
0
0 10 20 30 40 50 60
Aggregate volume fraction (%)
FIGURE 10.19 Stiffness versus aggregate volume fraction for small samples at the deformation
of 0.01 mm.