
Page 348 - Mechanics of Asphalt Microstructure and Micromechanics
P. 348
T
340 Ch a p t e r e n
Sample ID 2a 2b 3a 3b 4a 4b
Volume Aggregates 5.87 4.04 22.42 23.49 50.52 49.91
fraction Voids 3.48 1.18 1.77 2.46 12.97 11.26
TABLE 10.3 Volume fraction (%) of aggregates and voids.
the FEM simulation. The pure binder specimen and the 5% aggregate specimen were
tested for back-calculating the material constants of the elastic and viscoplasticity mod-
els for aggregates and the binder, respectively. Then these material constants were used
for modeling the other two specimens.
10.2.2.4 Volume Fraction of Aggregates and Voids
The actual volume fractions of aggregates and voids were obtained through 3D analysis
of reconstructed images. The volume fractions of aggregates and voids for each sample
are listed in Table 10.3. These values are important for the generation of the FEM.
For these small samples, the void volume fraction may be related to the aggregate
content. If more samples were made, a more accurate trend between the volume frac-
tions of the two phases might be obtained. This may imply that the void content can be
controlled by the aggregate content based on some statistic study results from 3D image
analysis. However, it should be pointed out that other factors such as the shape and
gradation of the aggregate will affect the volume fraction relationship.
10.2.2.5 Sample Testing
The maximum displacement recorded varies from 1 to 3 mm. However, only the begin-
ning part of the results was used to compare with finite element simulation results and
to back-calculate material parameters. Due to the lack of a damage or softening compo-
nent, simulation at large displacement may not be reasonable.
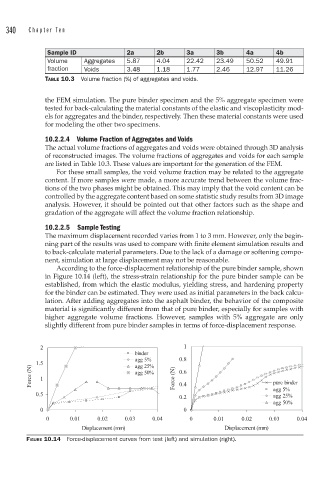
According to the force-displacement relationship of the pure binder sample, shown
in Figure 10.14 (left), the stress-strain relationship for the pure binder sample can be
established, from which the elastic modulus, yielding stress, and hardening property
for the binder can be estimated. They were used as initial parameters in the back calcu-
lation. After adding aggregates into the asphalt binder, the behavior of the composite
material is significantly different from that of pure binder, especially for samples with
higher aggregate volume fractions. However, samples with 5% aggregate are only
slightly different from pure binder samples in terms of force-displacement response.
2 1
binder
agg 5% 0.8
1.5 agg 25%
Force (N) 1 agg 50% Force (N) 0.6 pure binder
0.4
0.5 agg 5%
agg 25%
0.2
agg 50%
0 0
0 0.01 0.02 0.03 0.04 0 0.01 0.02 0.03 0.04
Displacement (mm) Displacement (mm)
FIGURE 10.14 Force-displacement curves from test (left) and simulation (right).