Page 343 - Mechanics of Asphalt Microstructure and Micromechanics
P. 343

Digital Specimen and Digital T est-Integration of Microstructure into Simulation   335


                      0.0025

                      0.0020

                      0.0015                                          Simulation
                                                                      Testing
                      0.0010

                      0.0005

                      0.0000
                           0       2      4       6      8      10   a. at 5°C
                      0.025

                      0.020

                      0.015
                                                                      Simulation
                                                                      Testing
                      0.010
                      0.005


                      0.000
                           0       2      4        6      8      10  b. at 40°C
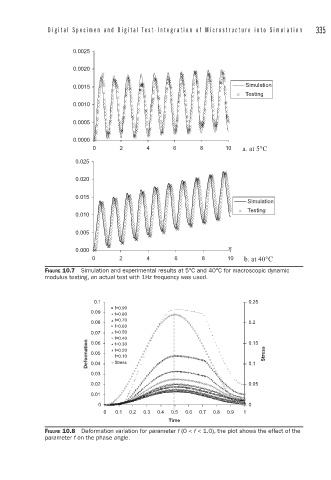
              FIGURE 10.7  Simulation and experimental results at 5°C and 40°C for macroscopic dynamic
              modulus testing, an actual test with 1Hz frequency was used.


                           0.1                                         0.25
                                 f=0.90
                           0.09
                                 f=0.80
                                 f=0.70
                           0.08                                        0.2
                                 f=0.60
                           0.07  f=0.50
                                 f=0.40                                0.15
                         Deformation  0.05  f=0.20                     0.1  Stress
                           0.06
                                 f=0.30
                                 f=0.10
                                 Stress
                           0.04
                           0.03
                           0.02                                        0.05
                           0.01
                             0                                         0
                              0  0.1  0.2  0.3  0.4  0.5  0.6  0.7  0.8  0.9  1
                                                Time
              FIGURE 10.8  Deformation variation for parameter f (0 < f < 1.0), the plot shows the effect of the
              parameter f on the phase angle.
   338   339   340   341   342   343   344   345   346   347   348